hizlik- Final

Update: As of 2020, an updated documentation for this project is now on my website at hiz.al/carscanner.

Little Car Scanning Underbellies of Big Cars

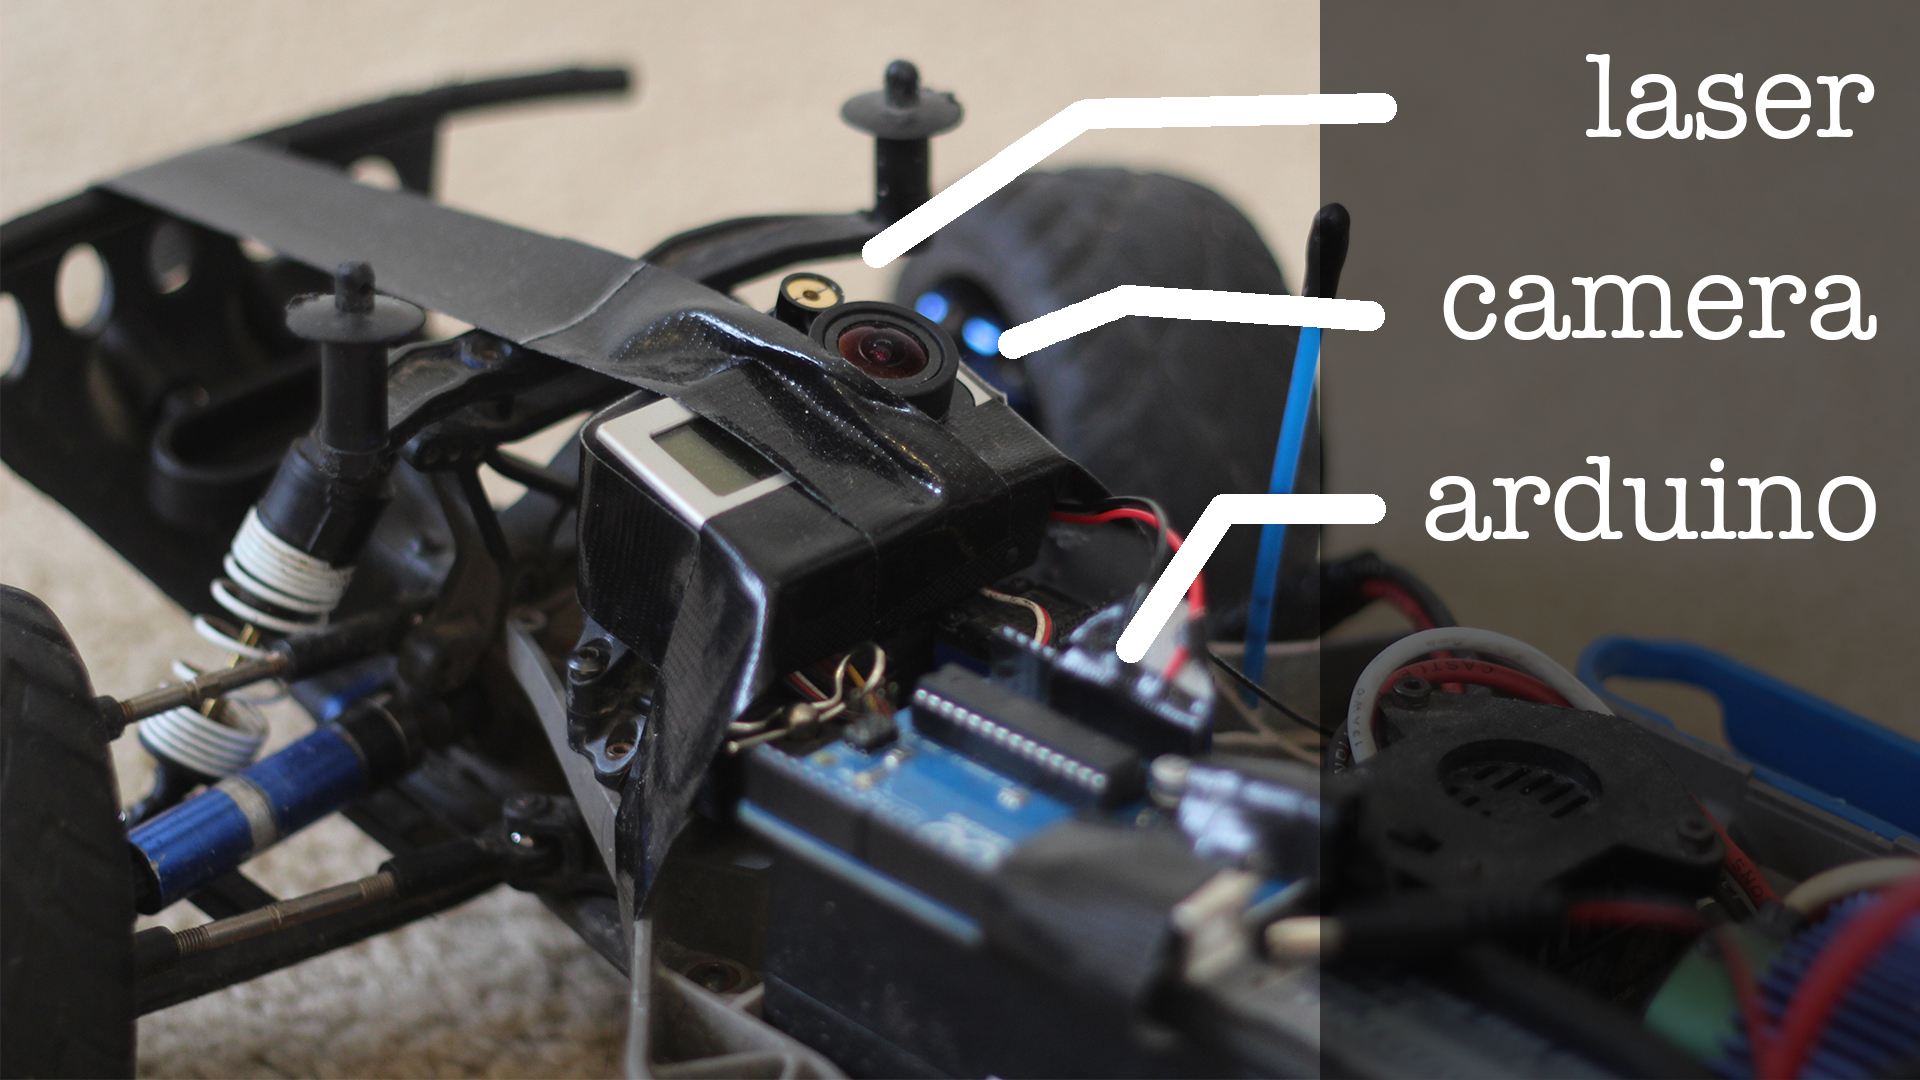
This little car is equipped with a line laser ($10 on Adafruit), a GoPro and an Arduino Uno.
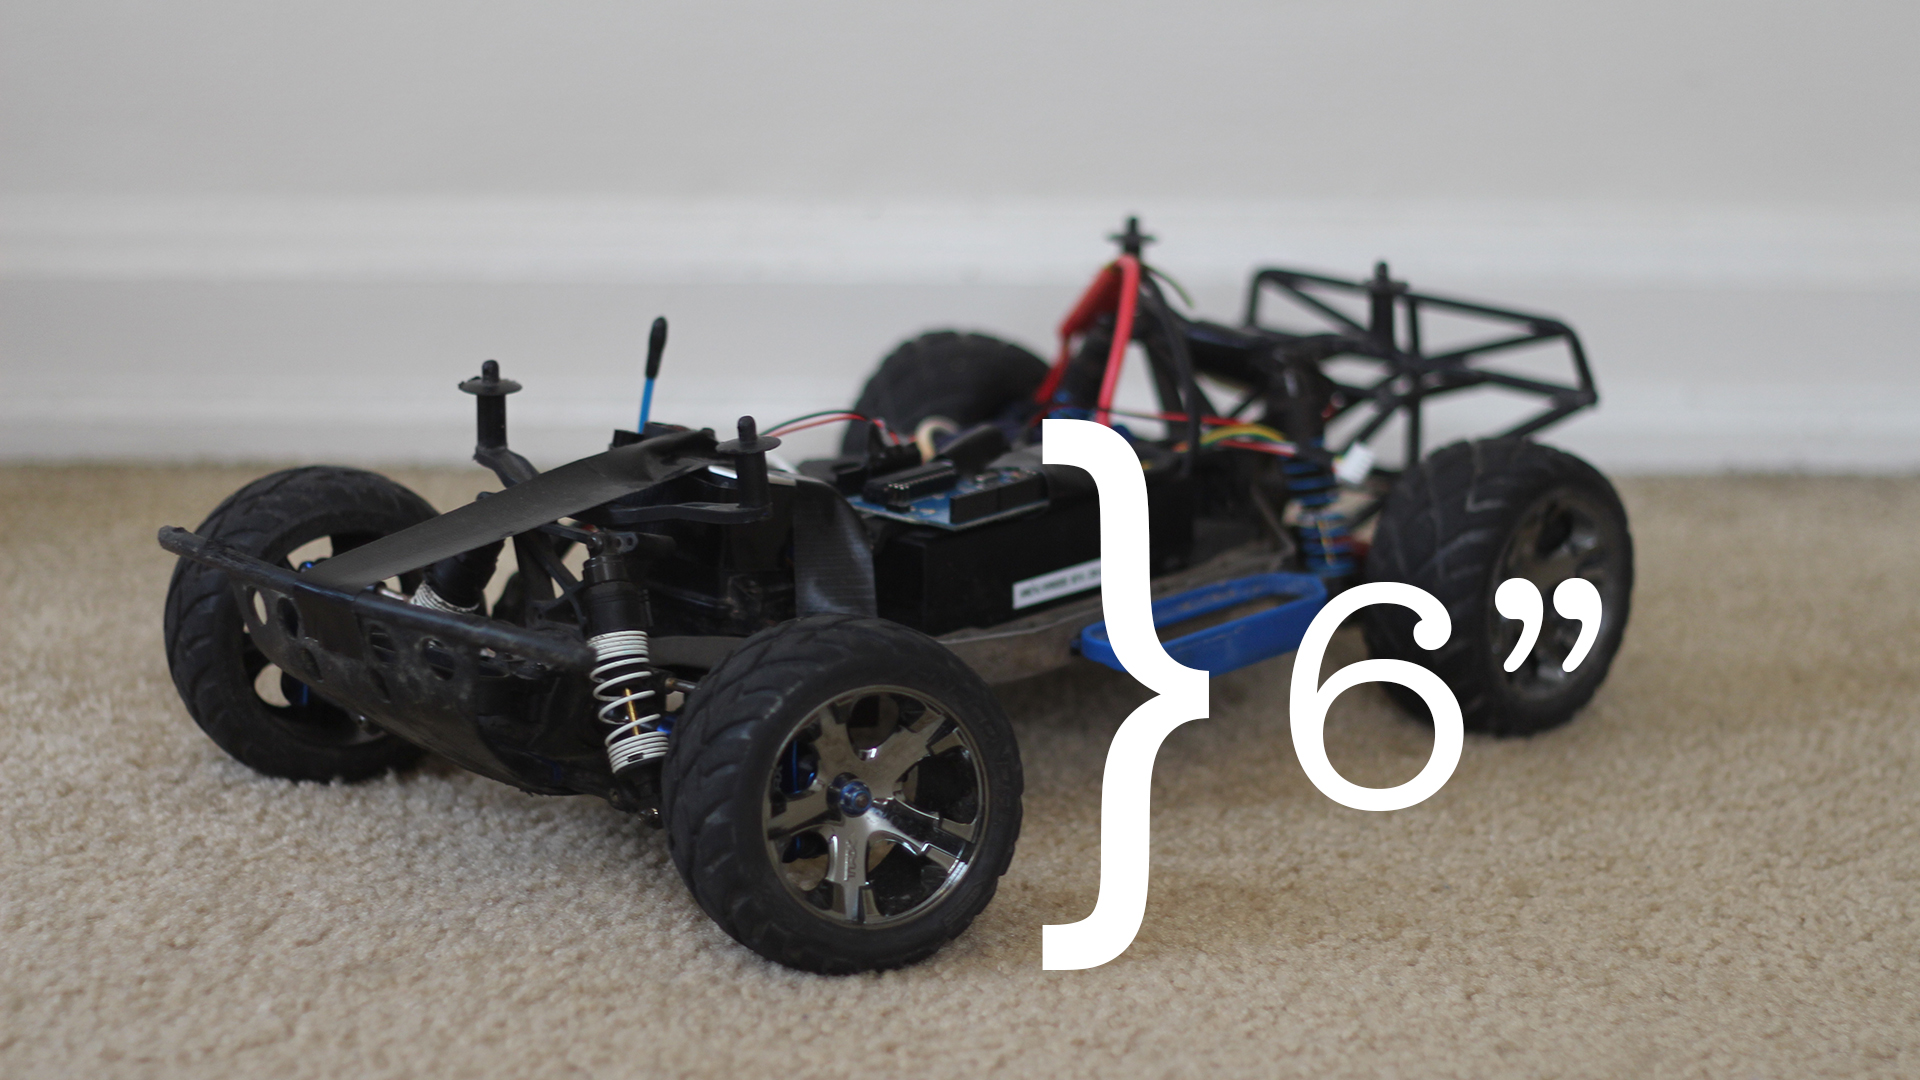
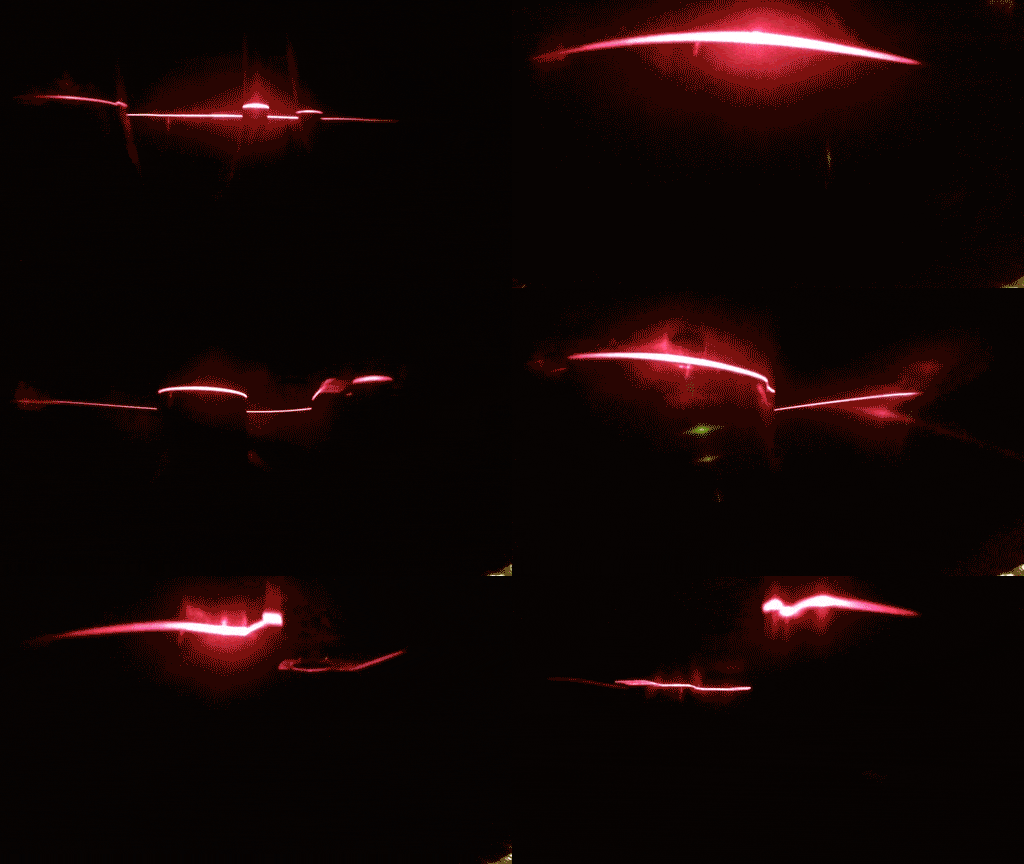
When driven via remote control underneath vehicles at a constant rate of speed, capturing footage at 60fps, I am able to get an accurate reading of an approximately 1ft wide space of the underside of a vehicle, to be parsed into point-cloud data and eventually a 3D-printable model.
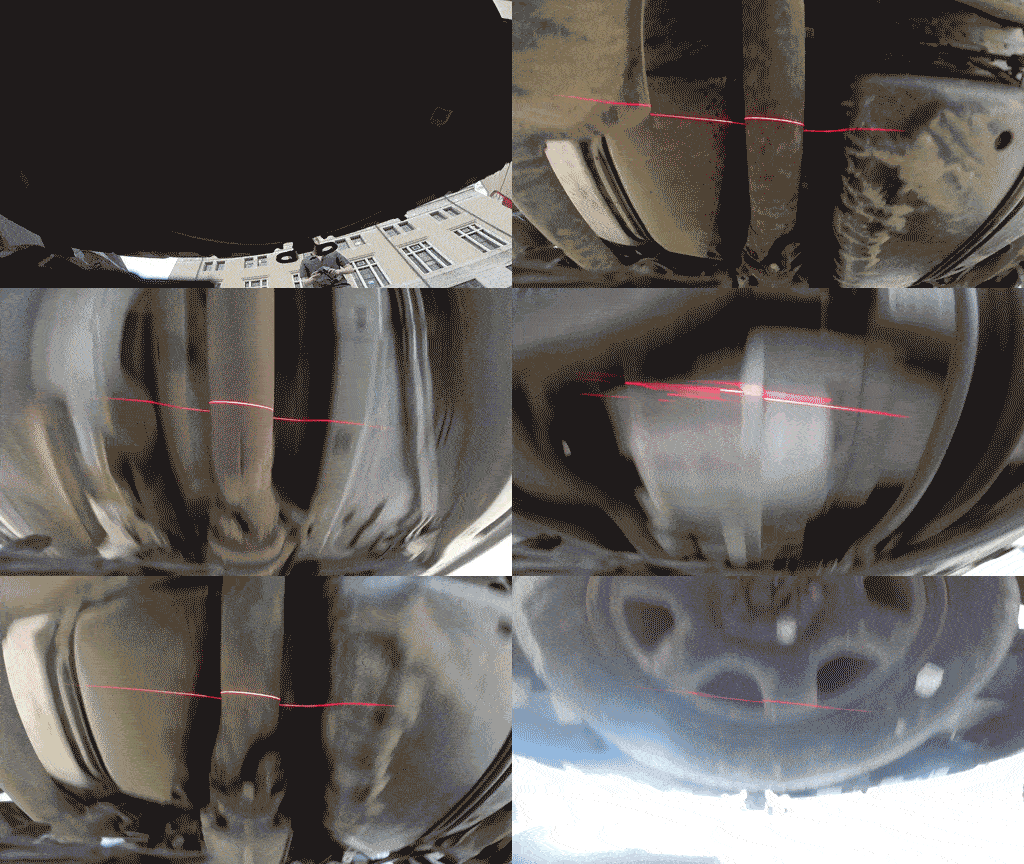
After experimenting with Photoshop and After Effects color-matching filters, I decided to write my own processing script to extract the laser’s path in the footage. I discovered it works best with footage shot in the dark, because it provided the cleanest and brightest result.
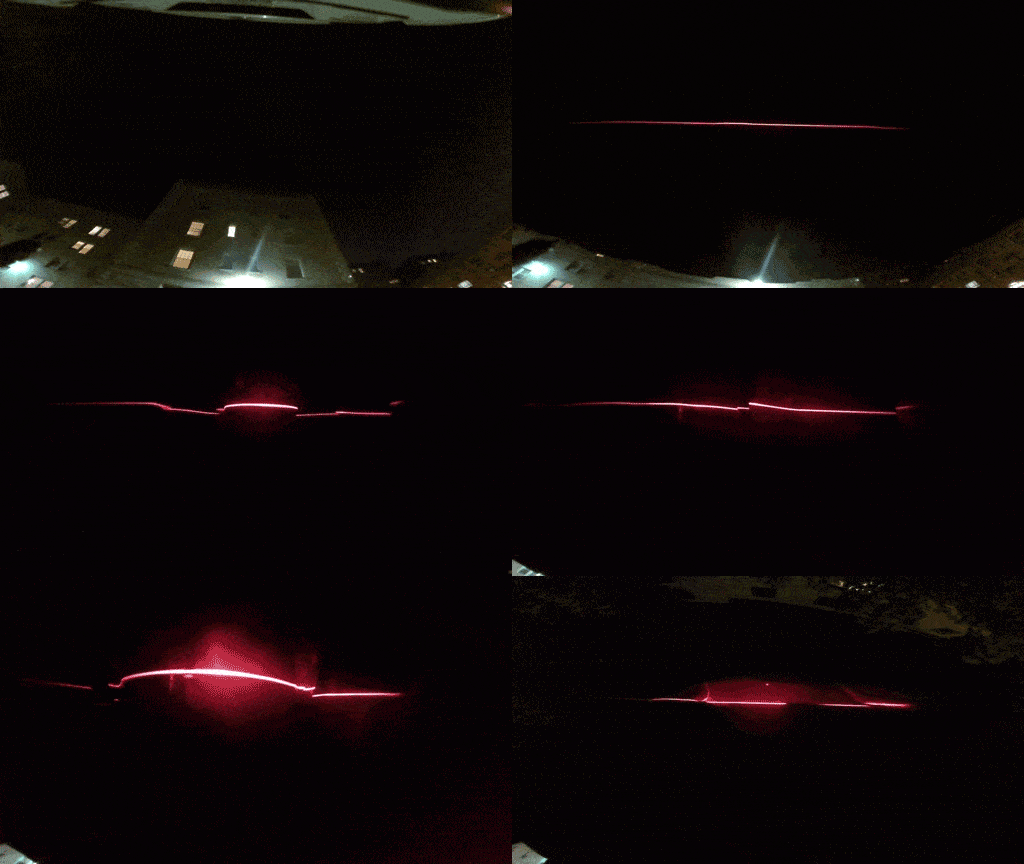
My script essentially tries to find the brightest and reddest color per column of pixels in the video. I also use averaging and other threshold values to “clean” unwanted data.


Processing: Analyze images for red laser path

String path = "/path/to/car/frames";
File dir; 
File [] files;
//int f_index = 0;
PImage img;
//PVector[] points;
PVector[][] allpoints;
PVector[][] cleanpoints;
float[] frameAvgs;
float threshold = 30; // minimum red brightness
float spectrum = 75; // maximum distance from median

boolean debug = true;
boolean clean = false;
boolean pause = false;

int frame = 0;

void setup() {
  size(1280, 720, P3D);
  dir= new File(dataPath(path));
  println(dir);
  files= dir.listFiles();
  //points = new PVector[1280];
  allpoints = new PVector[files.length][1280];
  cleanpoints = new PVector[files.length][1280];
  frameAvgs = new float[files.length];
  convert();
  
  frameRate(30);
}

void convert() {
  for (int f_index = 0; f_index<files.length; f_index++) {
    String f = files[f_index].getAbsolutePath();
    PVector points[] = new PVector[1280];
    PVector fullpoints[] = new PVector[1280];
    while (!f.toLowerCase().endsWith(".jpg")) {
      f_index = (f_index + 1)%files.length;
      f = files[f_index].getAbsolutePath();
    }
    //text(f, 10, 30);

    img = loadImage(f);

    for (int x=0; x<img.width; x++) {
      PVector p = new PVector(x, 0, 0);
      float red = 0;
      float total = 0;
      for (int y=0; y<img.height; y++) { color c = img.get(x, y); if (red(c) > red && red(c) + green(c) + blue(c) > total) {
          red = red(c);
          total = red(c) + green(c) + blue(c);
          p.y = y;
        }
      }
      // check red threshold
      fullpoints[x] = p;
      if (red < threshold) {
        p = null;
      }
      points[x] = p;
    }

    // remove outliers from center
    float avg = pass1(points);
    frameAvgs[f_index] = avg;

    // remove outliers from median
    pass2(avg, points);

    allpoints[f_index] = fullpoints;
    cleanpoints[f_index] = points;
  }
}

void draw() { 
  if (!pause) {
    background(0);
    frame = (frame + 1)%files.length;
    String f = files[frame].getAbsolutePath();
    while (!f.toLowerCase().endsWith(".jpg")) {
      frame = (frame + 1)%files.length;
      f = files[frame].getAbsolutePath();
    }
    text(f, 10, 30);
    drawLinesFast();
  }
}

public static float median(float[] m) {
  int middle = m.length/2;
  if (m.length%2 == 1) {
    return m[middle];
  } else {
    return (m[middle-1] + m[middle]) / 2.0;
  }
}

public static float mean(float[] m) {
  float sum = 0;
  for (int i = 0; i < m.length; i++) {
    sum += m[i];
  }
  return sum / m.length;
}

void keyPressed() {
  if (key == 'p') {
    pause = !pause;
  } else {
    debug = !debug;
    clean = !clean;
  }
}

// returns avg of points within the center
float pass1(PVector[] points) {
  float center = height/2-50;
  float sum = 0;
  int pointCount = 0;
  for (int i=0; i<points.length; i++) {
    if (points[i] != null && 
      (points[i].y < center+spectrum*2 && points[i].y > center-spectrum*2)) {
      sum += points[i].y;
      pointCount ++;
    }
  }

  return sum / pointCount;
}

void pass2(float avg, PVector[] points) {
  //float median = median(sort(depthValsCleaned));
  for (int i=0; i<points.length; i++) { if (points[i] != null && (points[i].y >= avg+spectrum
      || points[i].y <= avg-spectrum)
      && clean) {
      points[i] = null;
    }
  }
}

//void drawLines() {
//  background(0);
//  f_index = (f_index + 1)%files.length;
//  String f = files[f_index].getAbsolutePath();
//  while (!f.toLowerCase().endsWith(".jpg")) {
//    f_index = (f_index + 1)%files.length;
//    f = files[f_index].getAbsolutePath();
//  }
//  text(f, 10, 30);

//  img = loadImage(f);

//  for (int x=0; x<img.width; x++) {
//    PVector p = new PVector(x, 0, 0);
//    float red = 0;
//    float total = 0;
//    for (int y=0; y<img.height; y++) { // color c = img.get(x, y); // if (red(c) > red && red(c) + green(c) + blue(c) > total) {
//        red = red(c);
//        total = red(c) + green(c) + blue(c);
//        p.y = y;
//      }
//    }
//    // check red thresholdp
//    if (clean && red < threshold) {
//      p = null;
//    }
//    points[x] = p;
//  }

//  // remove outliers from center
//  float avg = pass1();

//  // remove outliers from median
//  pass2(avg);

//  // draw depth points
//  stroke(255, 0, 0);
//  strokeWeight(3);
//  for (int i=0; i<points.length; i++) {
//    if (points[i] != null)
//      point(points[i].x, points[i].y);
//  }
//  strokeWeight(1);

//  stroke(100);
//  //line(0, mean, width, mean);
//}


void drawLinesFast() {
  // draw depth points
  stroke(255, 0, 0);
  strokeWeight(3);
  if (clean) {
    for (int i=0; i<cleanpoints[frame].length; i++) {
      if (cleanpoints[frame][i] != null)
        point(cleanpoints[frame][i].x, cleanpoints[frame][i].y);
    }
  } else {
    for (int i=0; i<allpoints[frame].length; i++) {
      if (allpoints[frame][i] != null)
        point(allpoints[frame][i].x, allpoints[frame][i].y);
    }
  }
  if (debug) {
    float center = height/2-50;
    stroke(150);
    line(0, center-spectrum*2, width, center-spectrum*2);
    line(0, center+spectrum*2, width, center+spectrum*2);

    stroke(50);
    line(0, frameAvgs[frame]-spectrum, width, frameAvgs[frame]-spectrum);
    line(0, frameAvgs[frame]+spectrum, width, frameAvgs[frame]+spectrum);
  }
  //line(0, mean, width, mean);
}

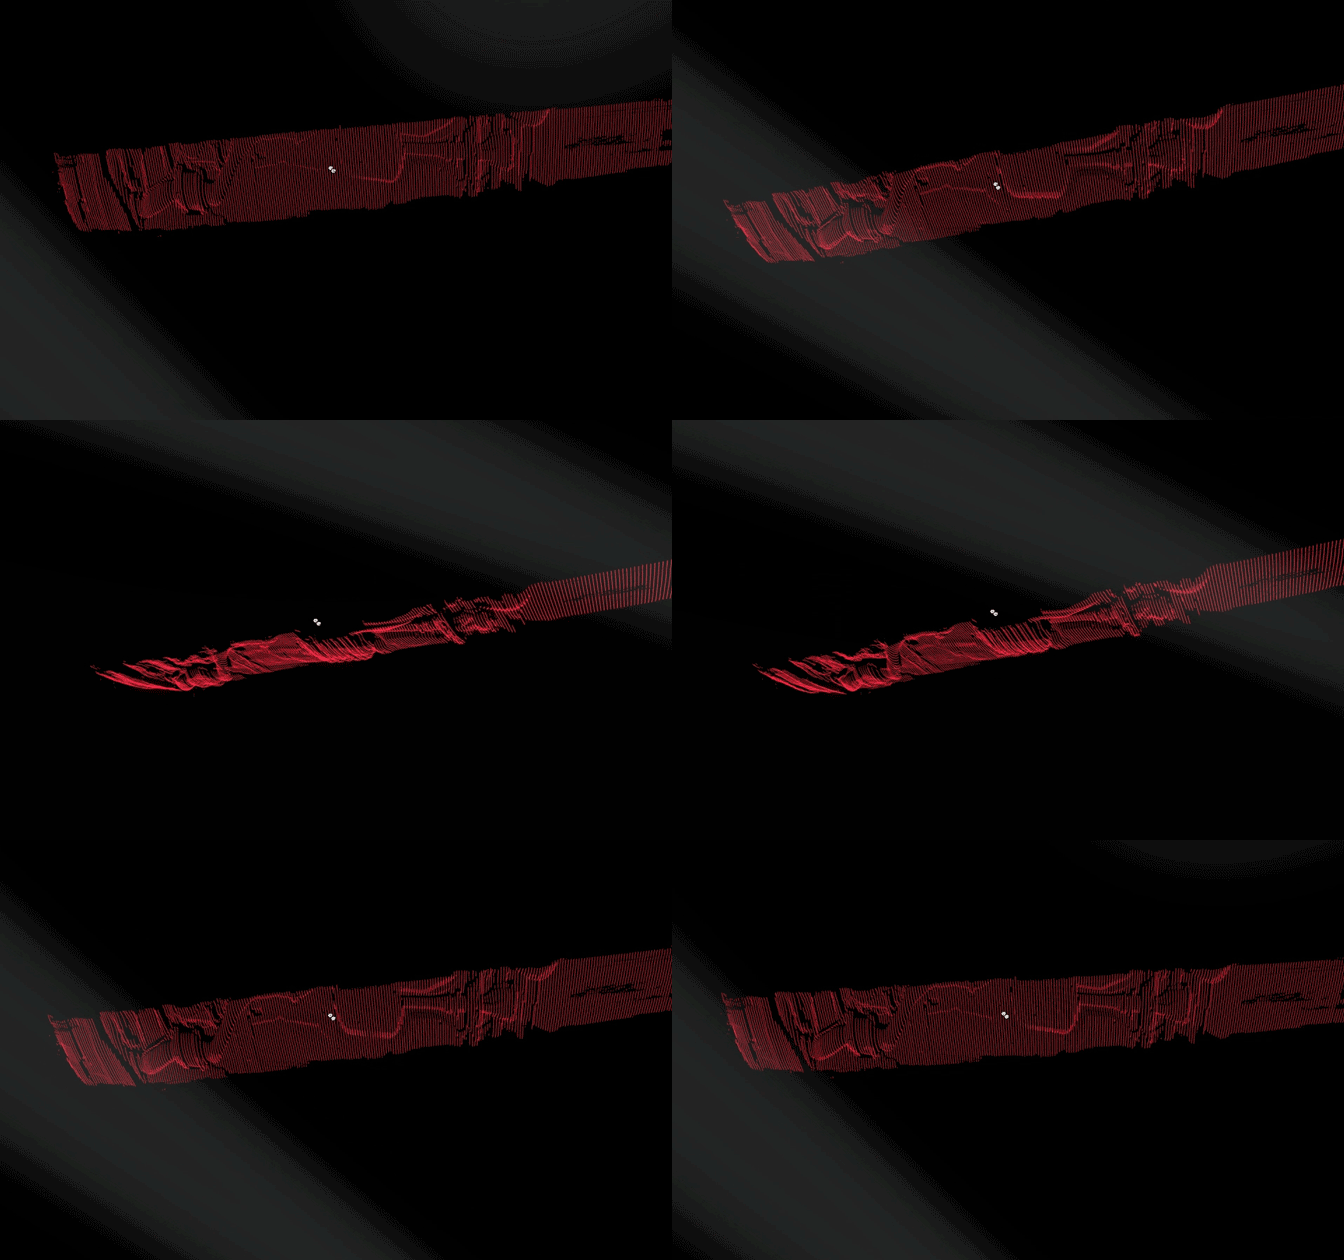
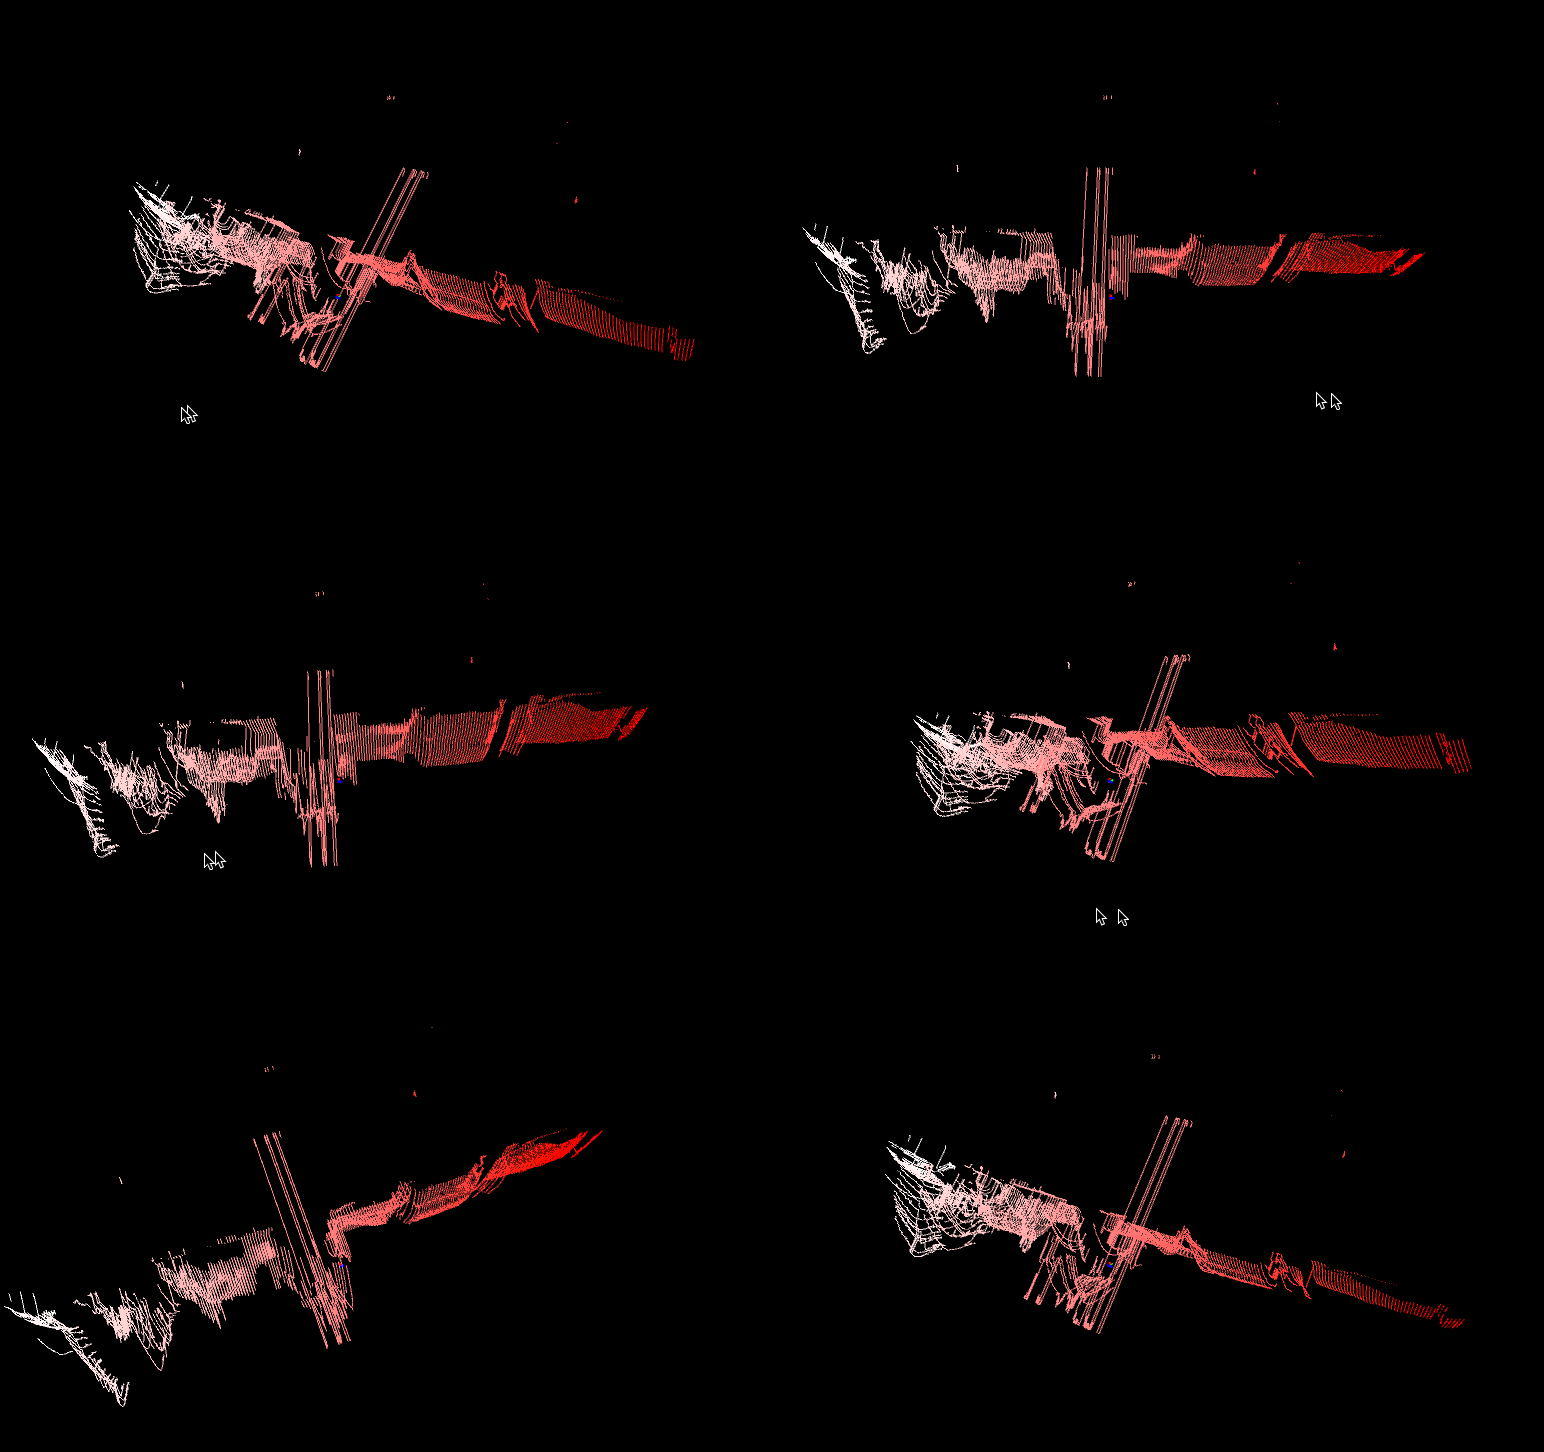
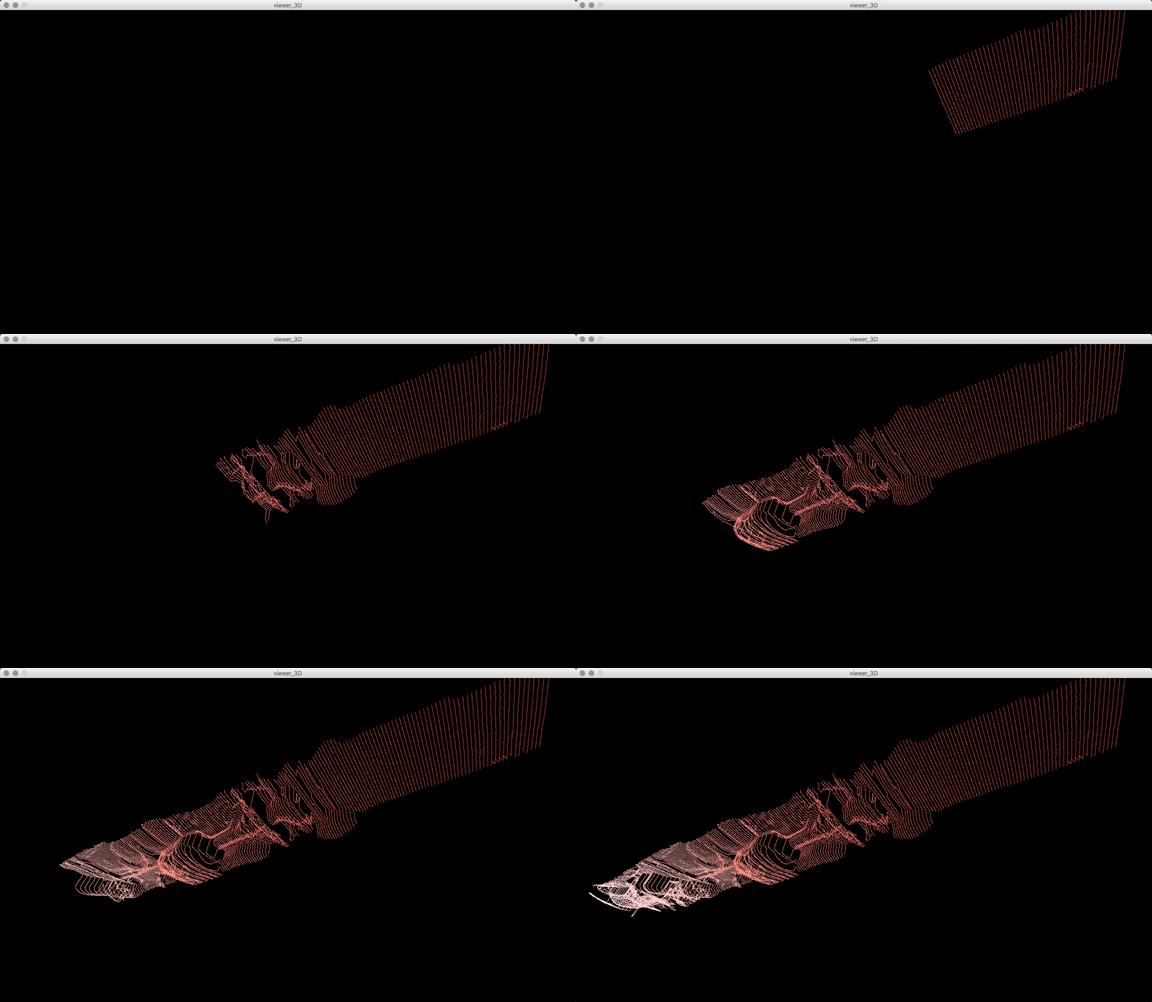
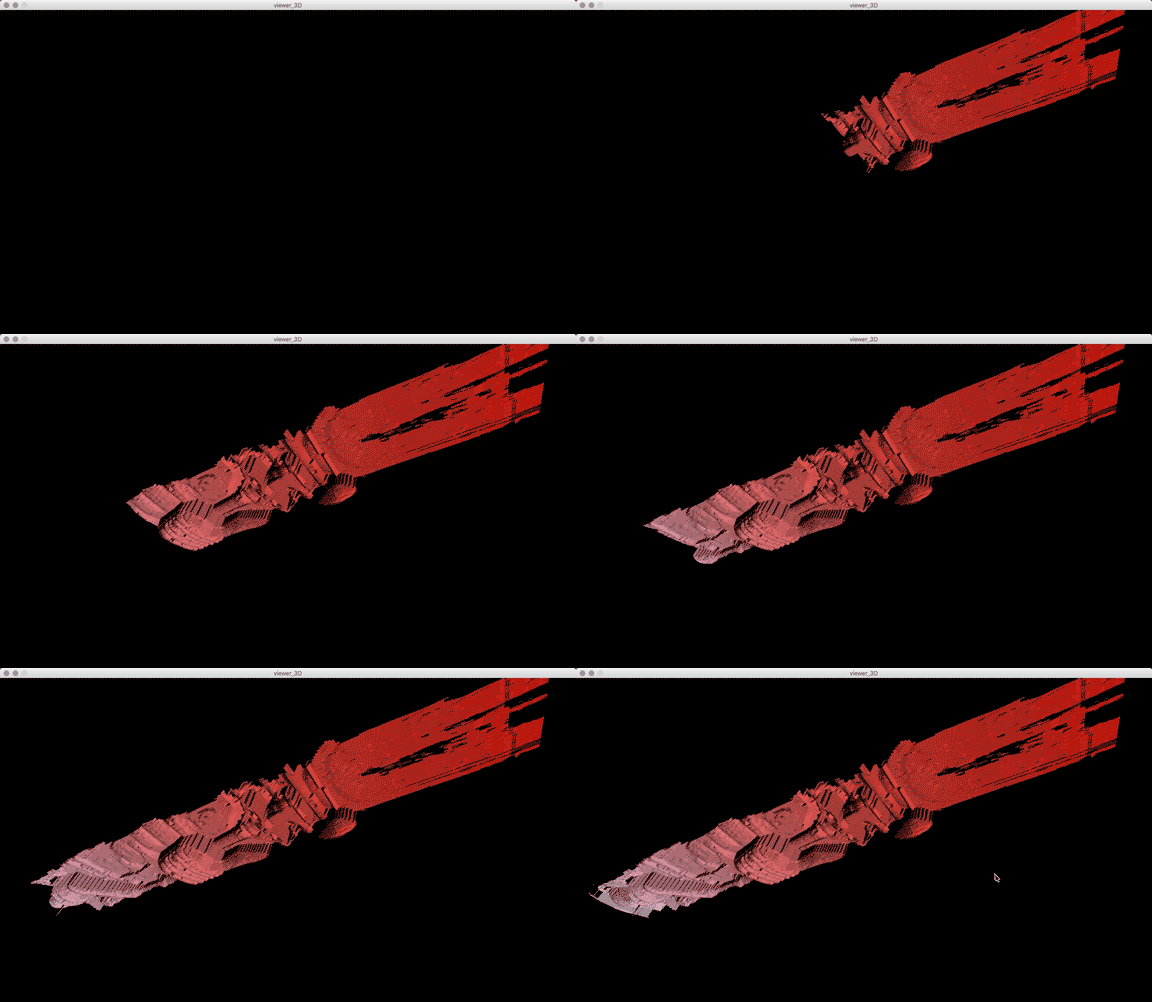
Once I got the algorithm down for analyzing the laser in each frame, I converted the y-value in each frame into the z-value of the 3D model, x was the same (width of video frame) and y-value of 3D-model to the index of each frame. The result looks like this when drawn in point-cloud form frame by frame:
Thanks to some help by Golan Levin in drawing in 3D in processing, this is the same model when drawn with triangle polygons:
Processing: Analyze images for red laser path, create 3D point cloud

String name = "subaru outback";
String path = "/Path/to/"+name+"/";
File dir; 
File [] files;
int f_index = 0;
PImage img;
PVector[] points;
PVector[][] allpoints;
float threshold = 30; // minimum red brightness
float spectrum = 75; // maximum distance from median

int smoothing = 1;
int detail = 1280/smoothing;
int spacing = 25;
float height_amplification = 4.5;

boolean lineview = true;
boolean pause = false;
int skip = 3;

int frameIndex = 0;

import peasy.*;
PeasyCam cam;

void setup() {
  size(1280, 720, P3D);
  surface.setResizable(true);
  //fullScreen(P3D);
  dir= new File(dataPath(path+"frames"));
  println(dir);
  files= dir.listFiles();
  allpoints = new PVector[files.length][detail];

  convert();
  //saveData();

  cam = new PeasyCam(this, 3000);
  cam.setMinimumDistance(10);
  cam.setMaximumDistance(3000);
  
  frameRate(30);
}

void draw() {
  if (!pause) {
    drawNew();
    frameIndex=(frameIndex+1)%files.length;
  }
}

void drawNew() {
  int nRows = files.length;
  int nCols = detail;
  background(0); 
  noStroke() ; 
  strokeWeight(1); 
  //float dirY = (mouseY / float(height) - 0.5) * 2;
  //float dirX = (mouseX / float(width) - 0.5) * 2;
  float dirX = -0.07343751;
  float dirY = -0.80277777;
  colorMode(HSB, 360, 100, 100);
  directionalLight(265, 13, 90, -dirX, -dirY, -1);

  directionalLight(137, 13, 90, dirX, dirY, 1);
  colorMode(RGB, 255);

  pushMatrix(); 
  translate(0, 0, 20);
  scale(.5); 
  fill(255, 200, 200); 

  if (lineview) {
    noFill();
    stroke(255, 255, 255);
    strokeWeight(2);
    for (int row=0; row<frameIndex; row++) {
      beginShape();
      for (int col=0; col<nCols; col++) {
        if (allpoints[row][col] != null && col%skip == 0) {
          float x= allpoints[row][col].x;
          float y= allpoints[row][col].y;
          float z= allpoints[row][col].z;
          stroke(255, map(row, 0, nRows, 0, 255), map(row, 0, nRows, 0, 255));
          vertex(x, y, z);
        }
      }
      endShape(OPEN);
    }
  } else {
    noStroke();
    for (int row=0; row<(frameIndex-1); row++) {
      fill(255, map(row, 0, nRows, 0, 255), map(row, 0, nRows, 0, 255));
      beginShape(TRIANGLES);
      for (int col = 0; col<(nCols-1); col++) {
        if (allpoints[row][col] != null &&
          allpoints[row+1][col] != null &&
          allpoints[row][col+1] != null &&
          allpoints[row+1][col+1] != null) {
          float x0 = allpoints[row][col].x;
          float y0 = allpoints[row][col].y;
          float z0 = allpoints[row][col].z;

          float x1 = allpoints[row][col+1].x;
          float y1 = allpoints[row][col+1].y;
          float z1 = allpoints[row][col+1].z;

          float x2 = allpoints[row+1][col].x;
          float y2 = allpoints[row+1][col].y;
          float z2 = allpoints[row+1][col].z;

          float x3 = allpoints[row+1][col+1].x;
          float y3 = allpoints[row+1][col+1].y;
          float z3 = allpoints[row+1][col+1].z;

          vertex(x0, y0, z0); 
          vertex(x1, y1, z1); 
          vertex(x2, y2, z2); 

          vertex(x2, y2, z2); 
          vertex(x1, y1, z1); 
          vertex(x3, y3, z3);
        }
      }
      endShape();
    }
  }

  //noFill();
  //strokeWeight(10);
  //stroke(0, 255, 0);
  //fill(0, 255, 0);
  //line(0, 0, 0, 25, 0, 0); // x
  //text("X", 25, 0, 0);

  //stroke(255, 0, 0);
  //fill(255, 0, 0);
  //line(0, 0, 0, 0, 25, 0); // y
  //text("Y", 0, 25, 0);

  //fill(0, 0, 255);
  //stroke(0, 0, 255);
  //line(0, 0, 0, 0, 0, 25); // z
  //text("Z", 0, 0, 25);

  popMatrix();
}

void convert() {
  for (int f_index = 0; f_index < files.length; f_index++) {
    points = new PVector[detail];
    String f = files[f_index].getAbsolutePath();
    while (!f.toLowerCase().endsWith(".jpg")) {
      f_index = (f_index + 1)%files.length;
      f = files[f_index].getAbsolutePath();
    }

    img = loadImage(f);

    for (int x=0; x<img.width; x+=smoothing) {
      PVector p = new PVector(x, 0, 0);
      float red = 0;
      float total = 0;
      for (int y=0; y<img.height; y++) { color c = img.get(x, y); if (red(c) > red && red(c) + green(c) + blue(c) > total) {
          red = red(c);
          total = red(c) + green(c) + blue(c);
          p.y = y;
        }
      }
      // check red threshold
      if (red < threshold) {
        p = null;
      }
      points[x/smoothing] = p;
    }

    // remove outliers from center
    float avg = pass1();

    // remove outliers from median
    pass2(avg);

    // draw depth points
    for (int i=0; i<points.length; i++) {
      if (points[i] != null) {
        //point(points[i].x, points[i].y);
        float x = i - (detail/2);
        float y = (f_index - (files.length/2))*spacing;
        float z = (points[i].y-height/4)*-1*height_amplification;
        allpoints[f_index][i] = new PVector(x, y, z);
      } else {
        allpoints[f_index][i] = null;
      }
    }
  }
}

// returns avg of points within the center
float pass1() {
  float center = height/2-50;
  float sum = 0;
  int pointCount = 0;
  for (int i=0; i<points.length; i++) {
    if (points[i] != null && 
      (points[i].y < center+spectrum*2 && points[i].y > center-spectrum*2)) {
      sum += points[i].y;
      pointCount ++;
    }
  }
  return sum / pointCount;
}

void pass2(float avg) {
  for (int i=0; i<points.length; i++) { if (points[i] != null && (points[i].y >= avg+spectrum
      || points[i].y <= avg-spectrum)) {
      points[i] = null;
    }
  }
}

void keyPressed() {
  if (key == 'p')
    pause = !pause;
  if (key == 'v')
    lineview = !lineview;
}

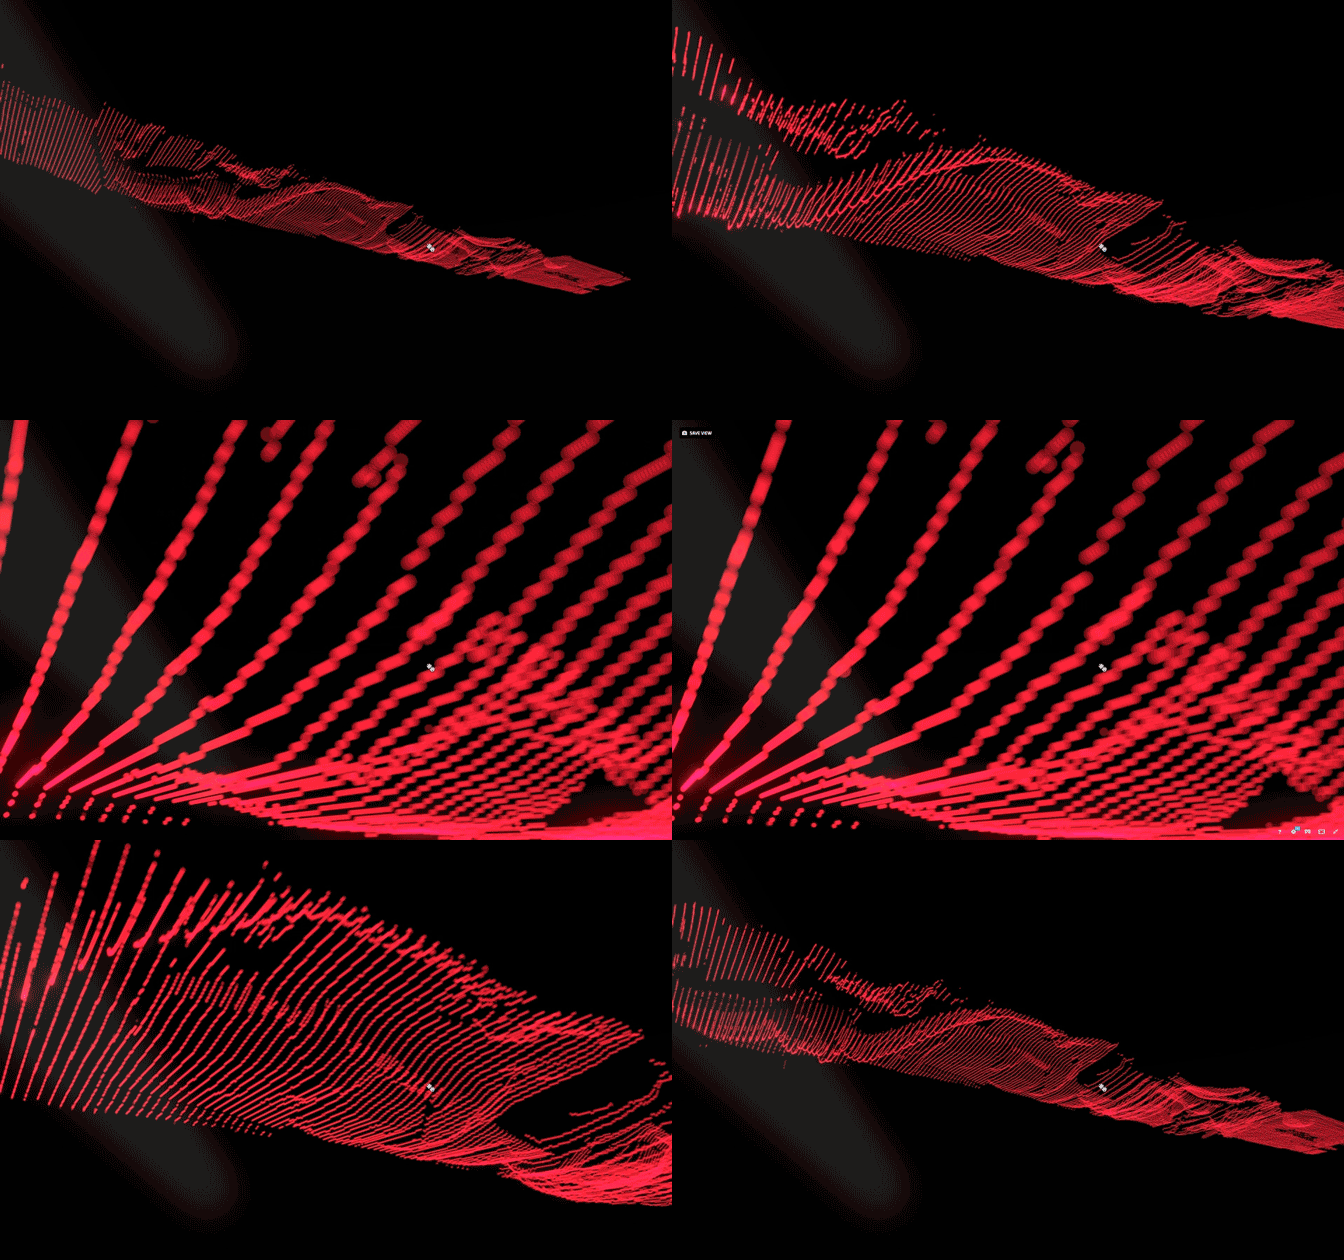
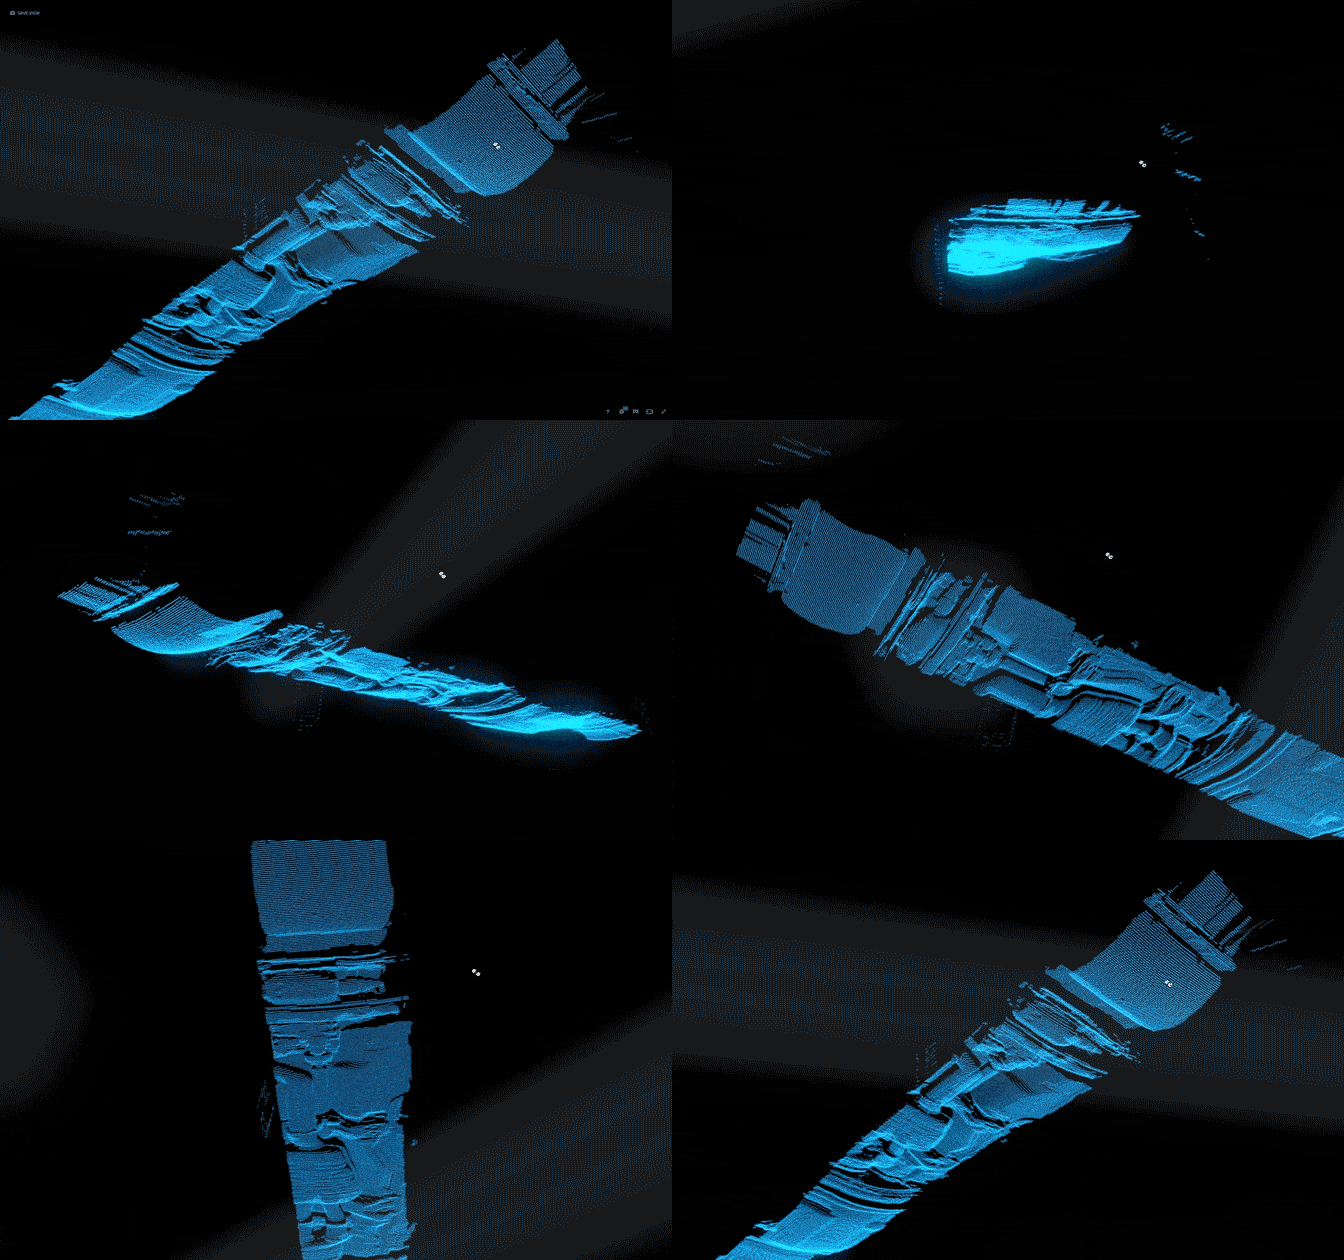
I then exported all the points in a .ply file and uploaded them to Sketchfab, which all models are viewable below (best viewed in fullscreen). 

Volvo XC60

Subaru Outback

The resolution is a bit less because the car was driven at a higher speed.

3D Print

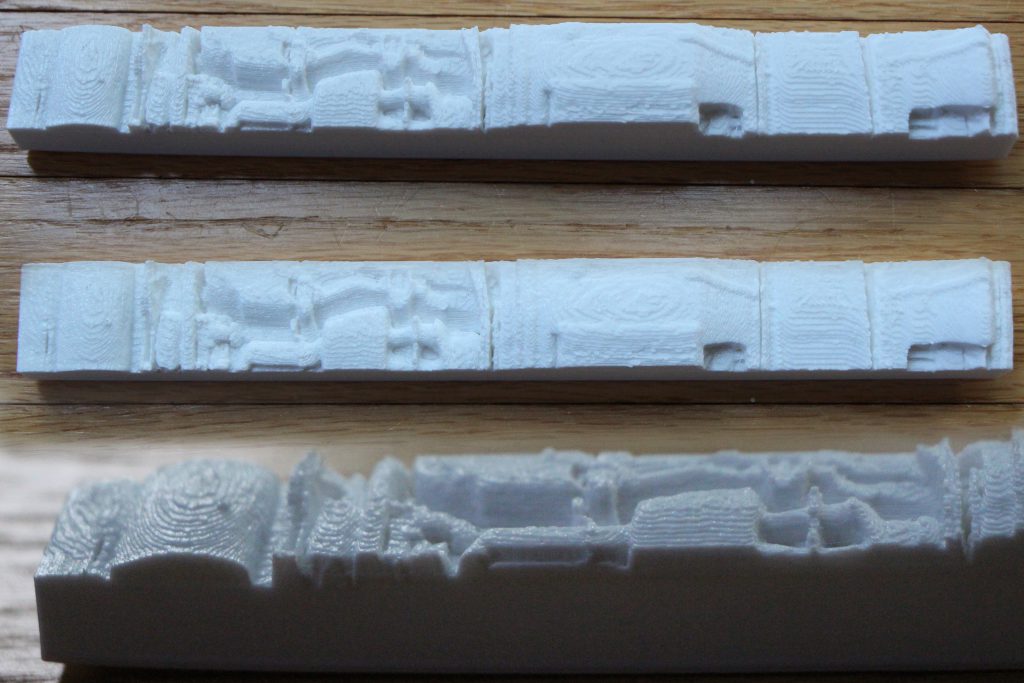
As a final step in this process, I was recommended to try 3D printing one of the scans, which I think turned out amazing in the end! There were a few steps to this process. The first was to fill in the gaps created from missing point data in the point cloud. I approached this in two different ways-first I used an average of the edges to cut off outliers. Then I extended the points closest to the edge horizontally until they reached the edge. And lastly, any missing points inside the mesh would be filled in using linear interpolation between the two nearest points on either side. This helped create a watertight top-side mesh. Then with the help of student Glowylamp, the watertight 3D model was created in Rhino and readied for printing using the MakerBot. The following are the process and results of the 3D print.

Special Thanks

Golan Levin, Claire Hentschker, Glowylamp, Processing and Sketchfab
ISSUES

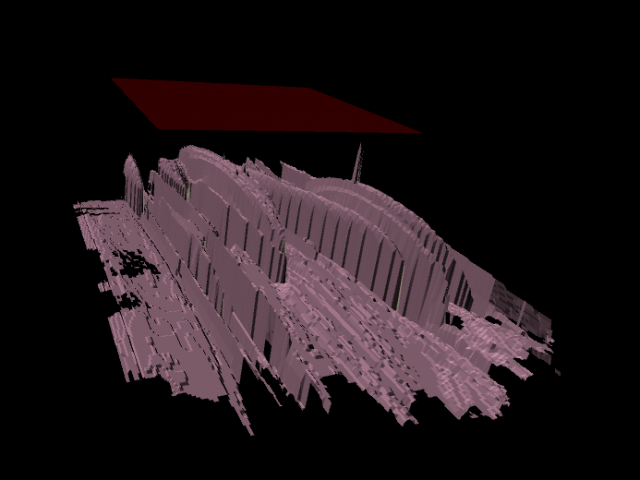
I had a few hiccups along the development of this app. The first was, embarrassingly enough, mixing the width and length values in the 3D viewer, resulting in this which we all thought was correctly displaying the underside of a vehicle, somehow:

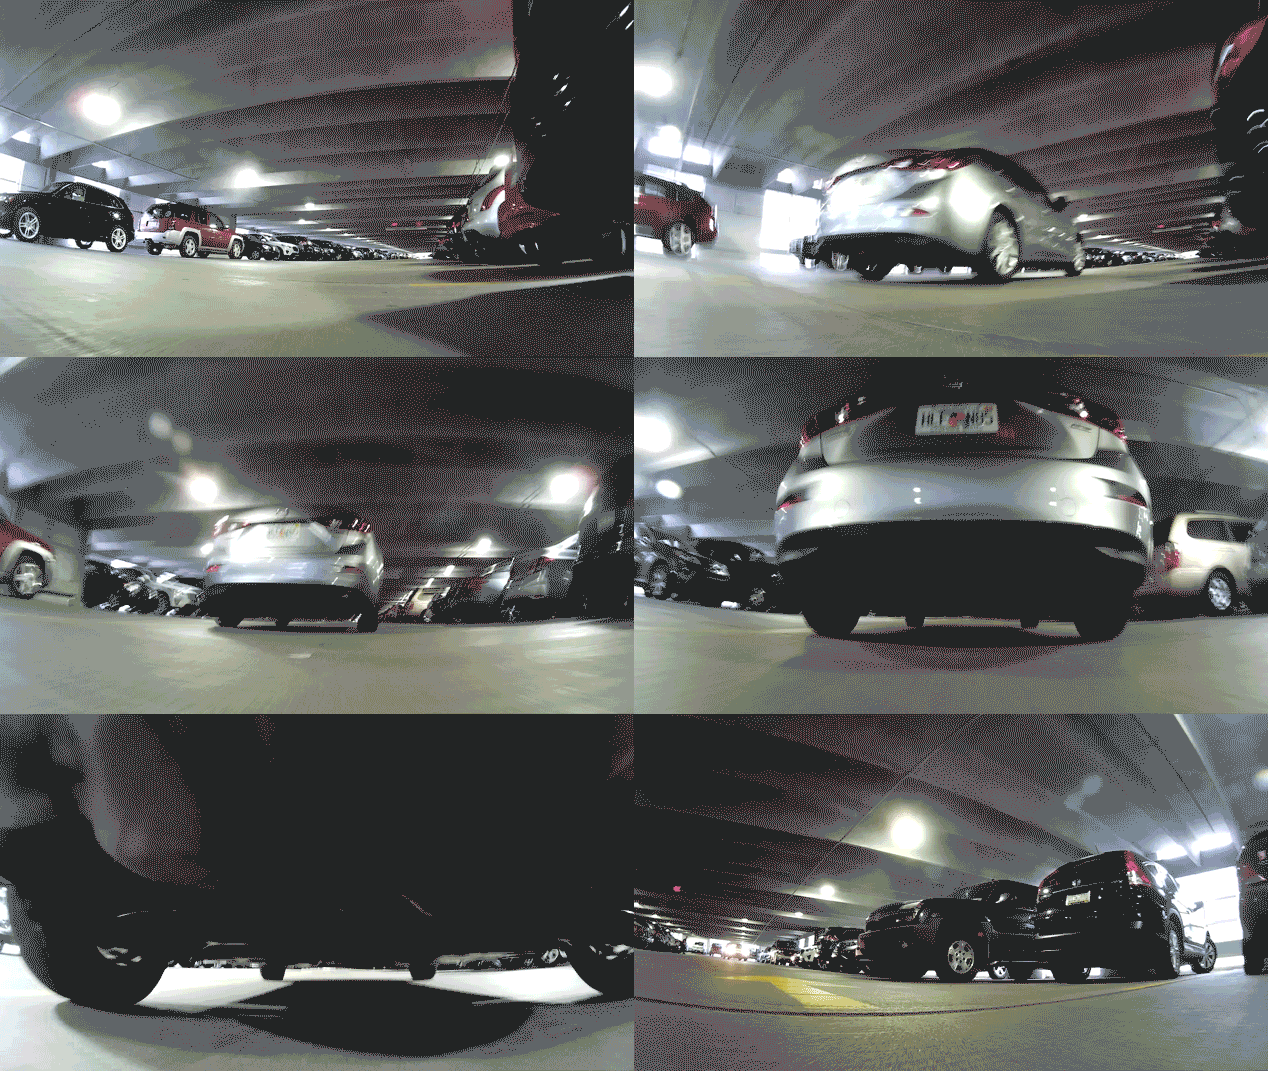
The other issue was the various forms of recording under vehicles. The following footage is the underside of a particularly shiny new Kia Soul:

Which resulted in a less-than-favorable 3D point cloud render:

There are also plenty of other renders that are bad due to non-ideal lighting conditions.

hizlik-finalProposal

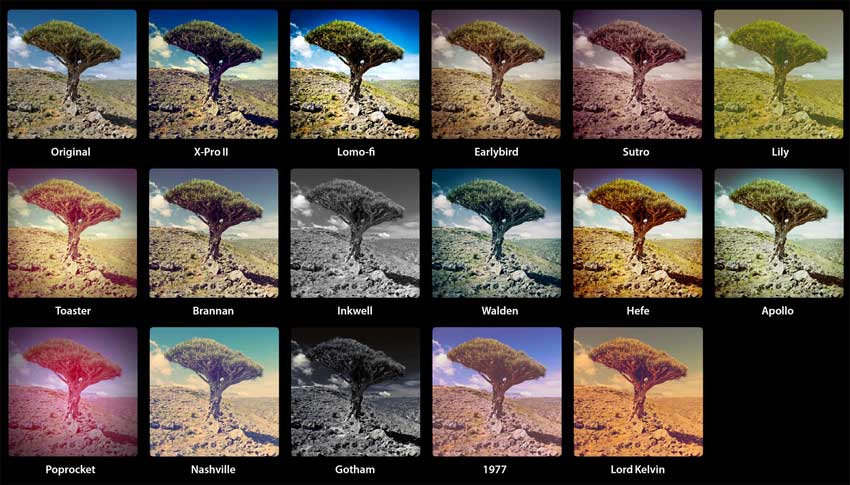
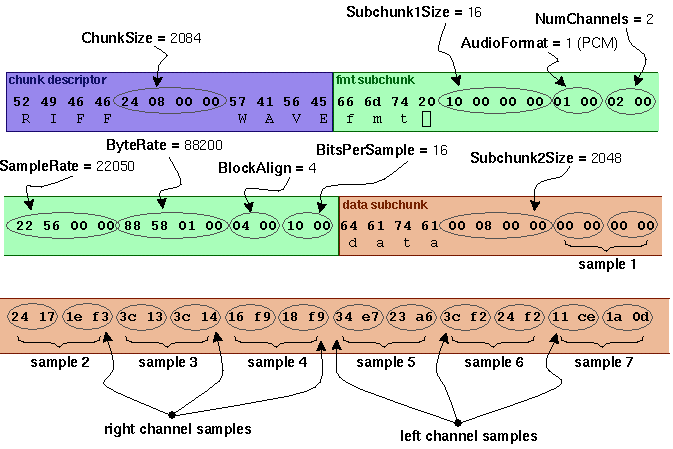
In simplest terms, I want to create an applet that “applies Instagram filters to music” or other sound files. I did a lot of research into the methods and techniques this could be done with and I have a few options, all of which would technically yield different results. I would have to choose the perfect balance of what I want and what is possible.

Method 1 – FFT (spectrum analysis)

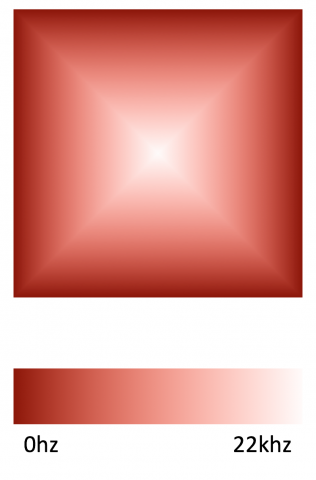
This is the original method I thought up of. At any given moment, the human ear can hear a range of frequencies (21 – 22,050 hz). The applet would, ideally in real-time, take each “moment” of sound from a sound file (or mic input?), convert the 22k frequencies into a RGB representation and plot them into an image form, apply the selected filter to the image, and read back in the new RGB values pixel-by-pixel to “rebuild” the sound. To be somewhat recognizable, I was thinking the image would be organized in spiral form, where the image is drawn inward starting with the outermost border of pixels, and progress up the frequency range as it does so. This way the image would have bass tones on the outside, and the higher the pitch, the more center the image. In this method, an Instagram filter that applies a vignette effect would accomplish the same as a bass-boost, if I choose for it to behave that way. Of course, the direction of sound can be applied in reverse as well (bass on inside).

PROS:

  • Since the filter is applied to entire sound spectrum, and the spectrum is organized in a data-vis kind of human readable way, it would act as expected and could yield recognizable, fun and understandable results (deeper bass, modified treble, etc).
  • Full control over how sound is visualized and applied. FFT results one value per frequency (amplitude/volume), which can be interpreted with an RGBA value in any way.

CONS:

  • Realtime may be slow or impossible. It may be impossible to “rebuild” sound based on just modified FFT values/ frequency values, as FFT is an average of the sound instance index <code>i</code> and <code>i-1</code>, I believe. And if possible, could be very complicated.
  • FFT has one value per frequency (amp/vol). A pixel is made up of RGB (and HSB), and optionally an alpha value. An Instagram filter will not only modify brightness, but possibly hue as well. How to convert all those variables back and forth with amp/vol? Would a hue shift result in a tonal shift too? And brightness is volume? Are all “tones/similar hues” averaged for volume? Added? Mean? Mode?

Method 2 – Equalizer

This is similar to Method 1 in that it applies the effect as it goes, to the sound instance at that moment, preferably in real-time. However, instead of using FFT to do a full 22k spectrum analysis, it would go the route of sound equalizers, ones you’d see in DJ software of HiFi systems. I tried to find examples of this in Python and Java but they’re hard to find online and I don’t quite understand how I’d do this. The Minim library for Processing has “low-bandpass” and “high-bandpass” filters but I’m not quite sure how to do adjust these bandpass filters, and how to apply them in specific frequencies rather than just “high end” and “low end” sound. The use of Instagram filters would also be different than Method 1. I’m not quite sure how it would work, but my thought is applying the Instagram filter to a constant original image, “calculating the difference” between before/after pixel-by-pixel, and apply those pixels to specific frequencies or frequency ranges on the equalizer. Essentially the Instagram filters would be run once, perhaps loaded as variables in setup(), and the difference mentioned above would be calculated to a simple mathematical expression to be performed on the equalizer.

PROS:

  • Since the filter is applied to entire sound spectrum, and the spectrum is organized in a data-vis kind of human readable way, it would act as expected and could yield recognizable, fun and understandable results (deeper bass, modified treble, etc).
  • Full control over how sound is visualized and applied. Equalizer can apply one change per frequency (amplitude/volume), which can be interpreted with an RGBA value in any way.
  • Realtime is possible, depending on the efficiency of my coding. Other software does this, why can’t mine?

CONS:

  • A pixel is made up of RGB (and HSB), and optionally an alpha value. An Instagram filter will not only modify brightness, but possibly hue as well. How to convert all those variables back and forth with the equalizer adjustment? How would hue shift and brightness shift change things separately?

Method 3 – Song File

This is perhaps my least favorite idea because it applies to the entire song at once, which may yield results that don’t quite make sense. In this method I would essentially be reading a sound file’s encoding, such as .wav or .mp3, somehow decode it into readable sound files OR directly convert the filetype’s encoded hexadecimal values linearly into some kind of image (hexadecimal to RGB hex?), and that image would represent the music file as a whole. However, applying an Instagram filter on it would yield weird results. In method 1, a vignette could act as a bass-boost. However, this method may just boost the volume at the beginning and end of a song for example. The other blaring problem with this is that messing with encoding may just result in absolute gibberish noise.

PROS:

  • Potentially very fast execution, and could spit out a new, savable file as well (or just play it back, which probably requires saving the file as well and re-loading it with a proper MP3/WAV reader library

CONS:

  • Potentially garbage noise, or breaking the encoding/file entirely
  • Extremely complicated to encode/decode music files, or even just read them

hizlik-Event

Update: As of 2020, an updated documentation for this project is now on my website at hiz.al/3drc.

Inspiration

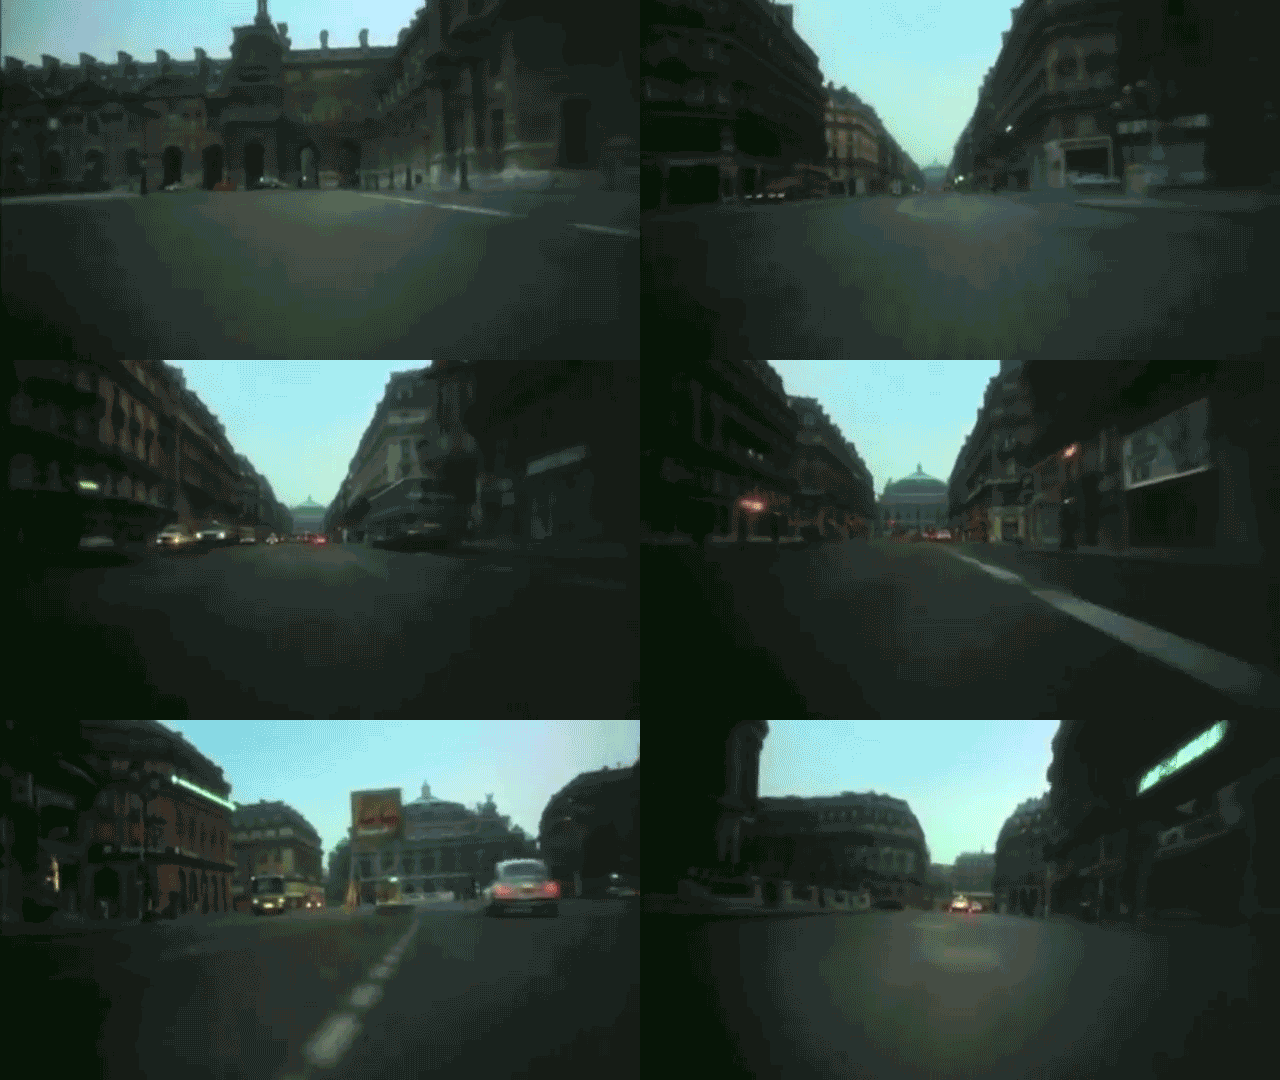
This project was inspired by C’était un rendez-vous (1976), a high-speed, single-shot drive through the streets of Paris in the early morning. I was really taken by the sounds of the revving engine, the shifting gears, and daredevil speeds through the cramped and winding streets of this old city.

Link: Rendevous (1976)

Description

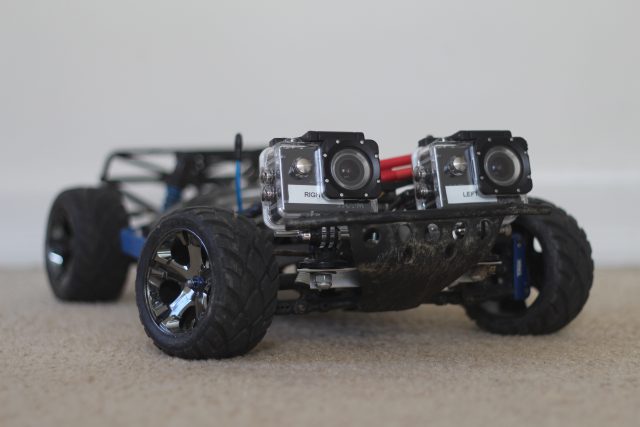
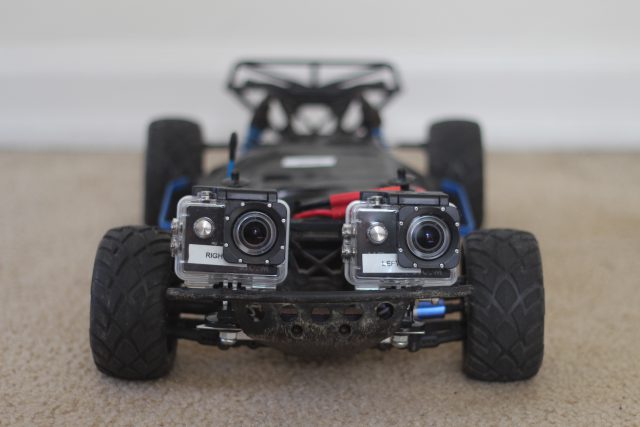
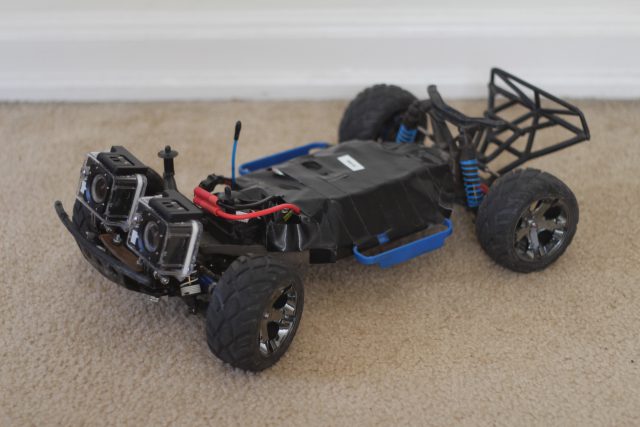
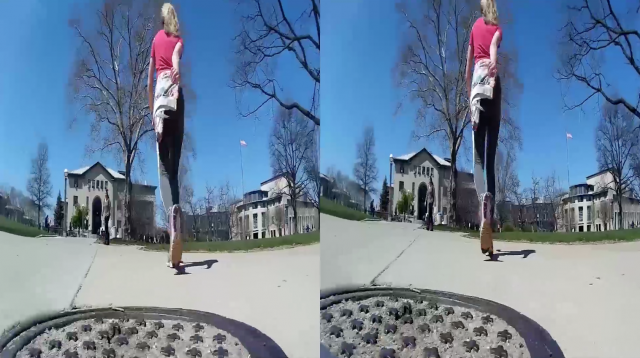
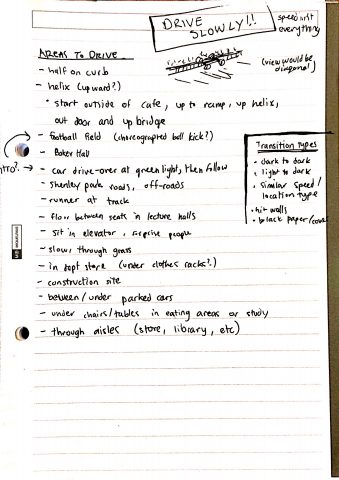
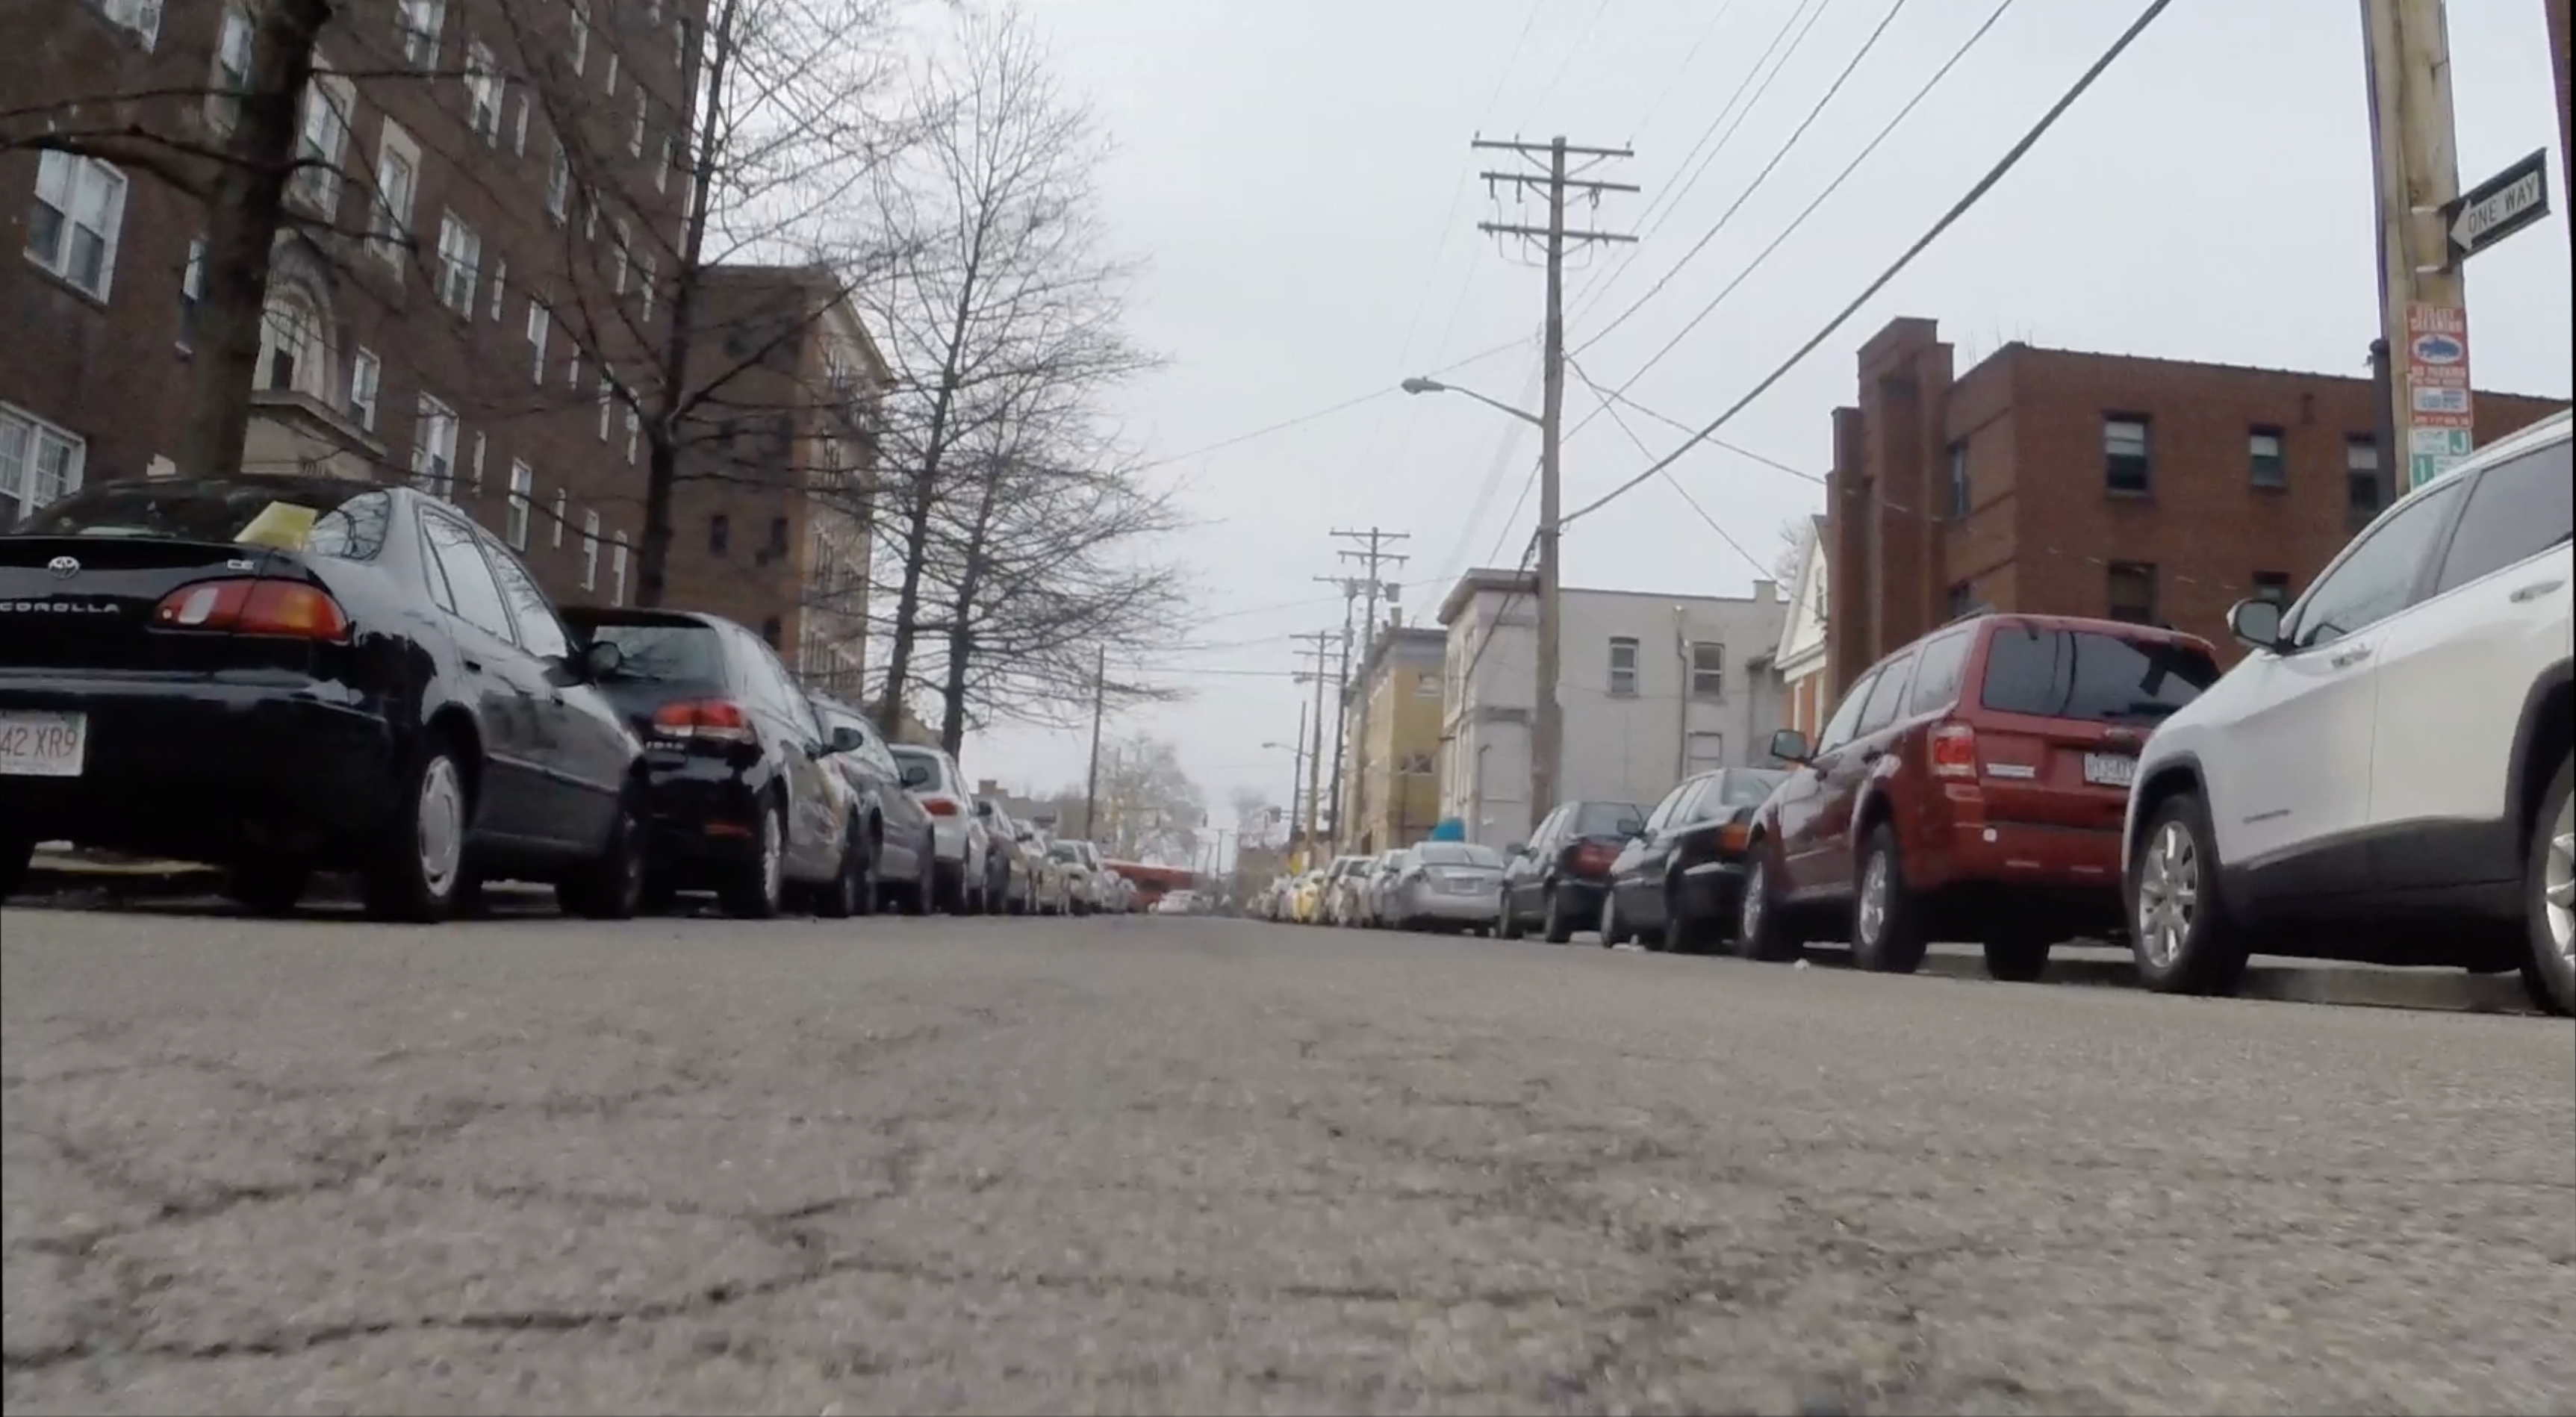
For this project, originally I wanted to make a parody/recreation of sorts by installing a camera on an radio-controlled (RC) car I have built and used in the past for projects and art. I also decided to use two cameras and create stereoscopic video so the viewer can feel more immersed (using a Google Cardboard or “3D” glasses). This decision was in part for personal reasons (I have never done stereoscopic video before) and a valued suggestion from a fellow classmate. While the first idea was to create a choreographed scene through the streets, sidewalks and buildings of Pitt and the CMU campus, Golan really enjoyed a part of some test footage I shot where I drive underneath a few parked cars. He said there was something very intimate about the underside of a vehicle, something almost not meant to be seen and fascinatingly unique perspective.

Planning

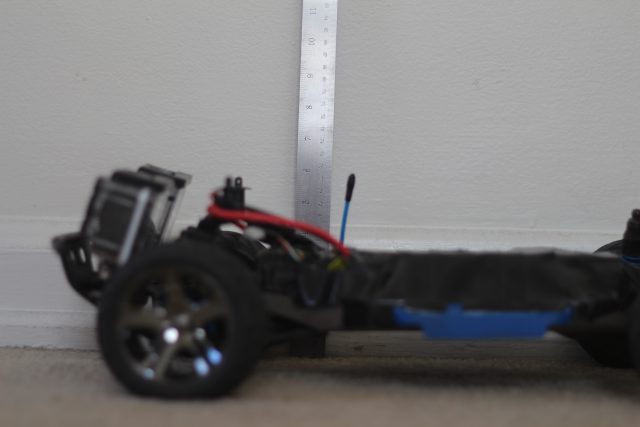
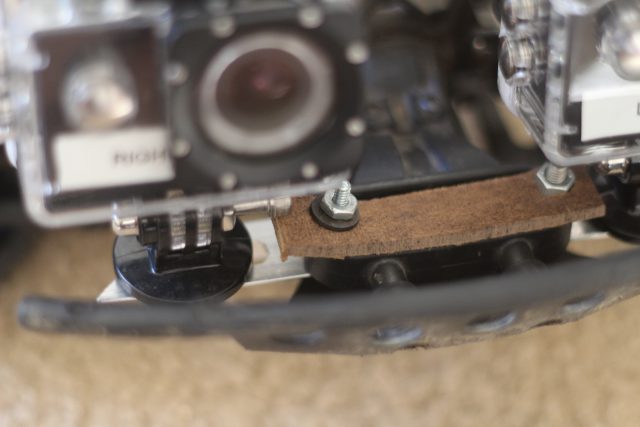
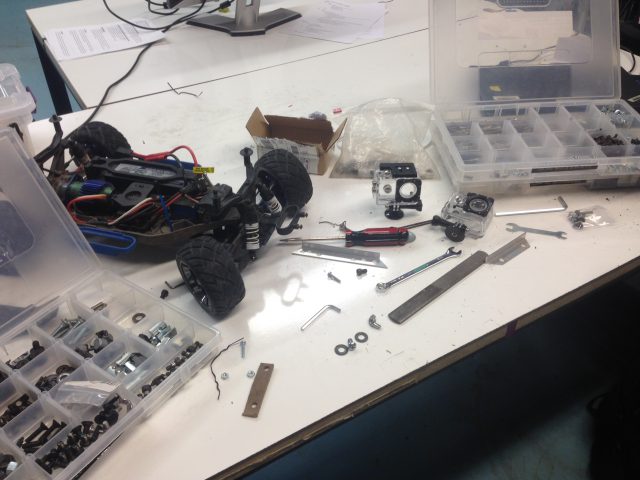
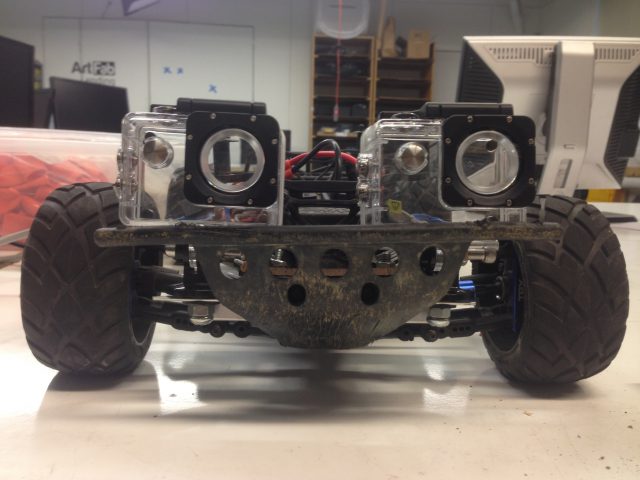
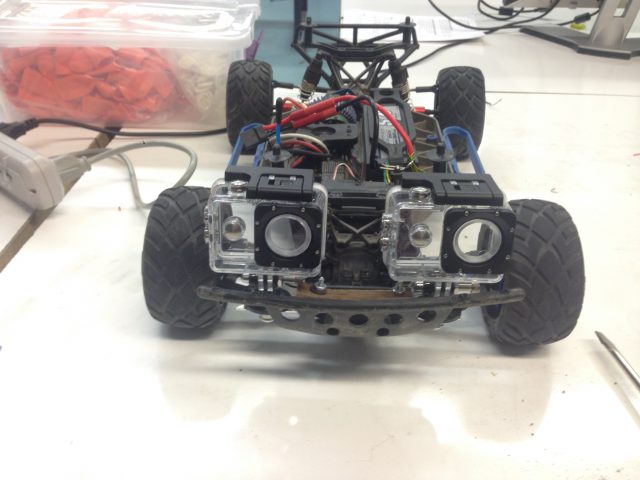
So I decided to work from that and try to capture various interesting places and things from this unique position, with the ability to drive up to 85mph as well. 🙂 After building a rig to hold two GoPro cameras, my car was about 6 inches tall, the perfect and ideal height to be able to drive under short gaps and small areas. The camera lenses were set wider apart than normal human eyes, however that worked to my benefit as that “exaggerated” the 3D depth effect, which helps make objects in the distance look more 3D than real life. This helps because the GoPro cameras naturally have wide-angle lenses that often make close-looking objects appear farther away, so this wide-set camera setup helped bring those far-but-close objects to life.

Filming

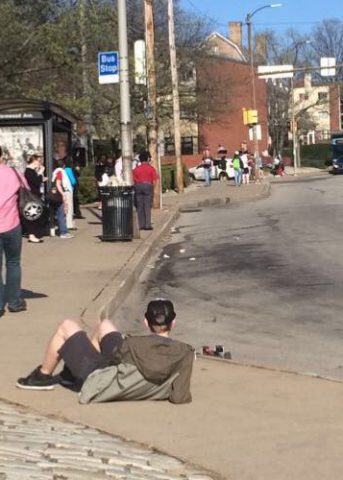
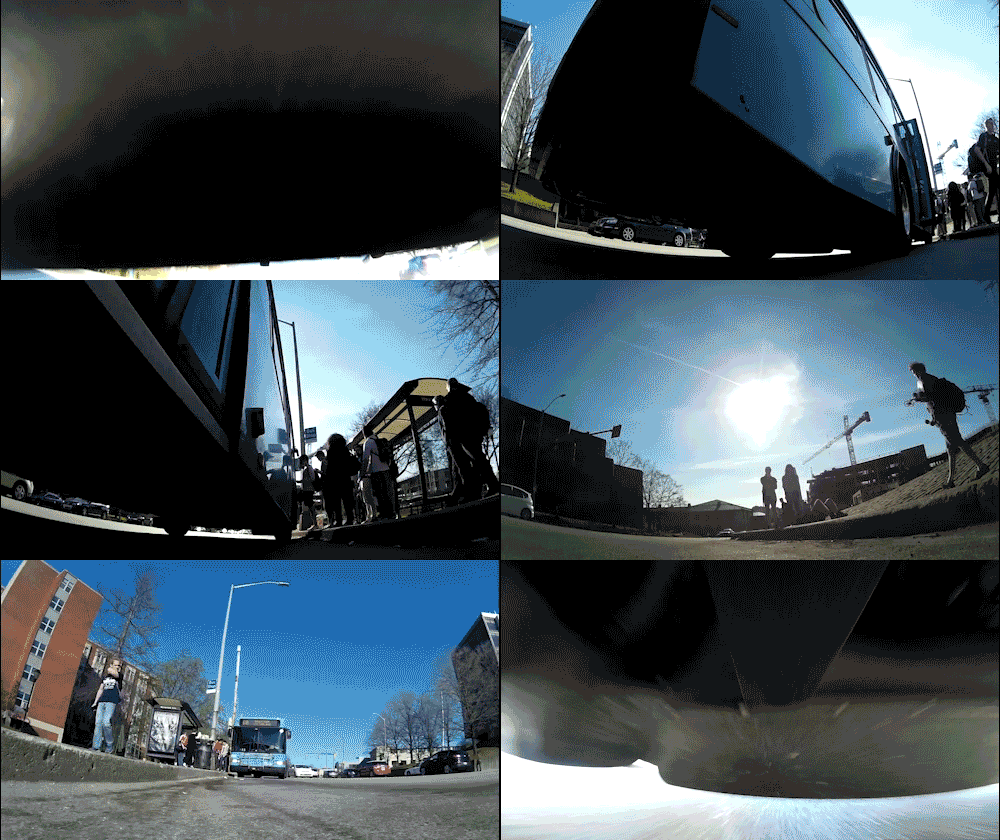
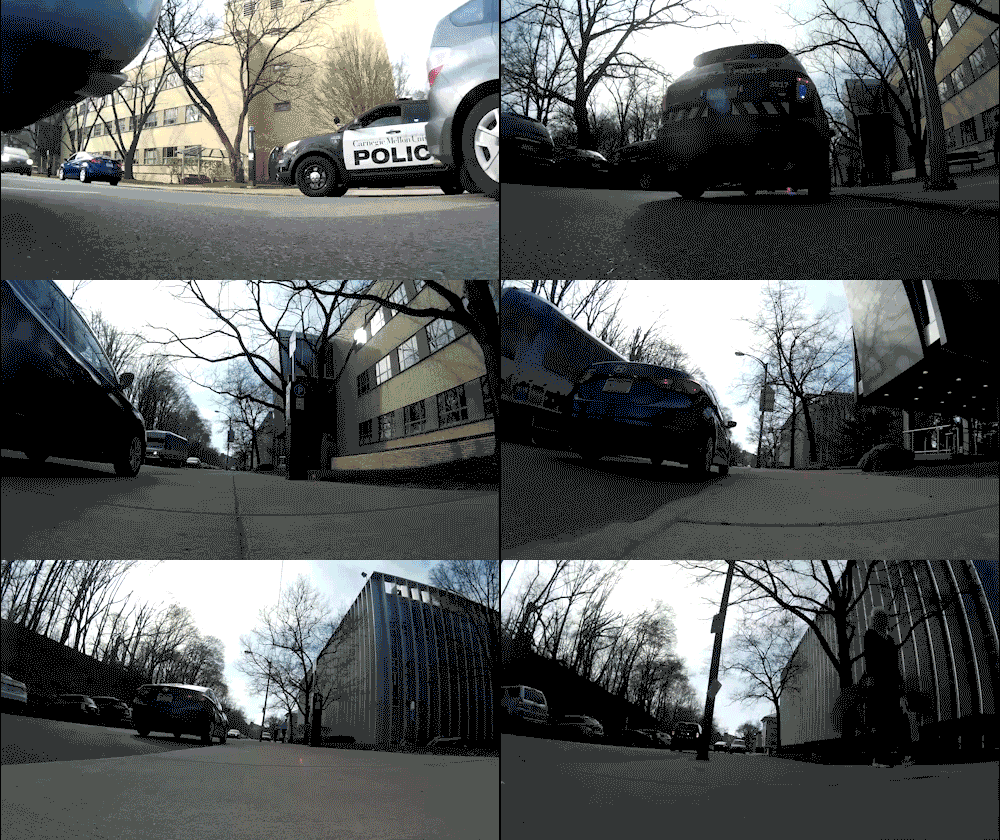
I travelled to different on- and off-campus locations, mainly focusing on how to integrate cars and traffic into my shot. While it was fun chasing after cars, driving under buses and even a police traffic stop, many of the more interesting shots came from the social interactions that occurred on-campus. From my high-above viewpoint of a third-floor studio, I was able to chase kids and follow people around campus. One particularly memorable moment was driving through a school tour group. Unfortunately a camera was knocked out of place without me knowing, and I was unable to use much of the day’s footage in the final video. I do, however, include some of my favorites shot in mono form, as a gif, at the bottom of this blog. This is a shot of me waiting for a bus to arrive so I could (safely) drive under the bus as it pulled up:

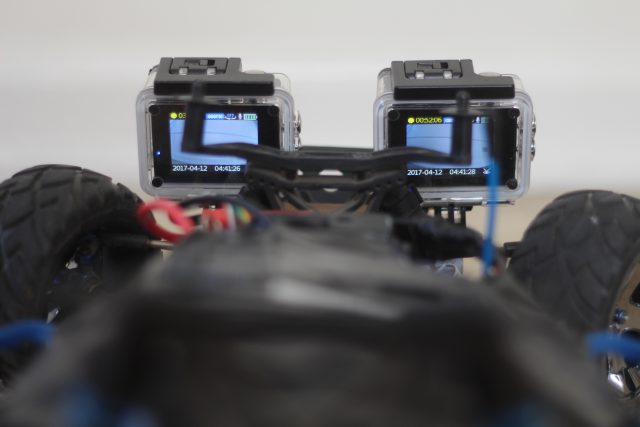
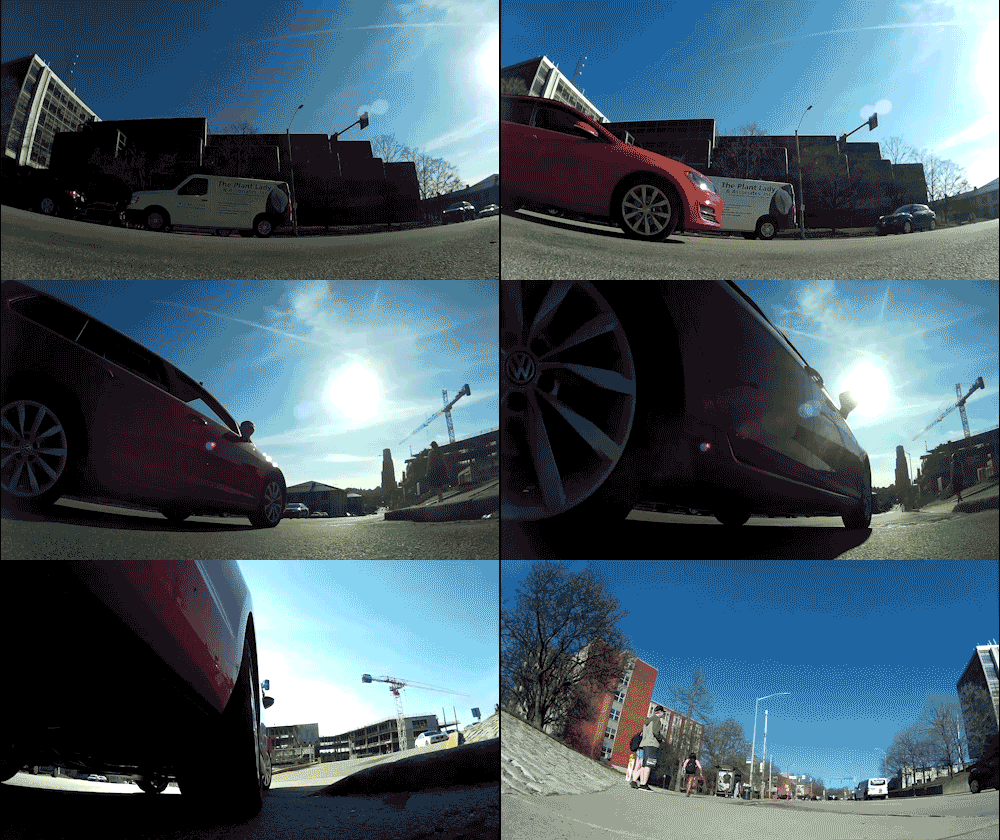
And this is what my car looks like driving around with two cameras and going under a vehicle:

Editing

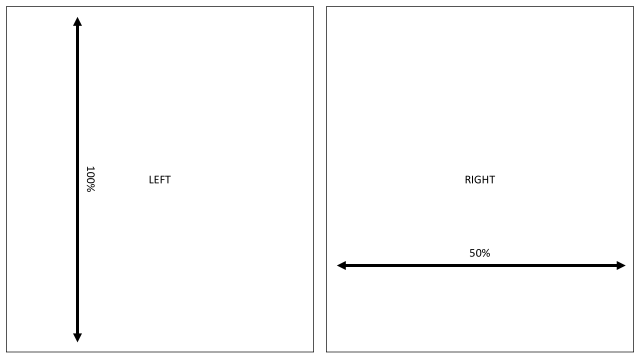
Once the footage has been shot, I learned that the process from camera to stereoscopic video on YouTube was very simple. All I have to do edit the footage to be side-by-side within one normal 16:9 video (pref. full HD or higher), with each “eye” scaled to 100% height and 50% width.

A screengrab from the final upload to YouTube looks like this:
When uploading to YouTube, there is a simple checkbox that automatically converts the video a stereoscopic format and creates three versions of the video for public viewing- mono version, anaglyphic version (the red/blue old-fashioned stereoscopic) and VR-ready video. An anaglyphic version may look like this:

and this is what you see through Google Cardboard or similar VR:

Issues

Throughout this project I discovered a few unexpected problems and/or risks:

  • Cameras mis-aligned (esp after bumps/crashes), causing issues with 3D-ness
  • Car sagging/scraping in front (fixed)
  • Car being run over (didn’t happen)
  • Cameras are farther apart than eyes in real life (extreme depth)
  • Rain
  • On-Camera sound is bad

Final Product

Be sure to use a Google Cardboard or similar VR headset to fully enjoy the depth effect! The anaglyphic mode really reduces the color spectrum of the video.

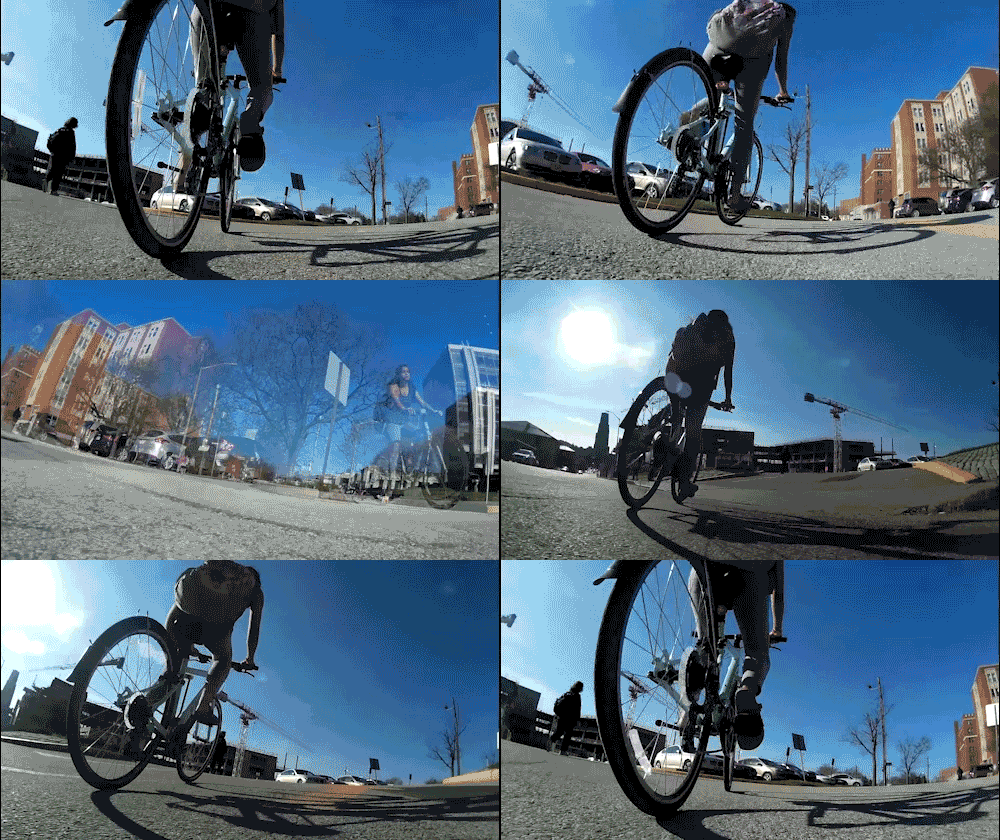
These are some loops that show my favorite moments, some of which are not in the final video (due to camera sync issues or just didn’t make the cut).

hizlik-EventProgress

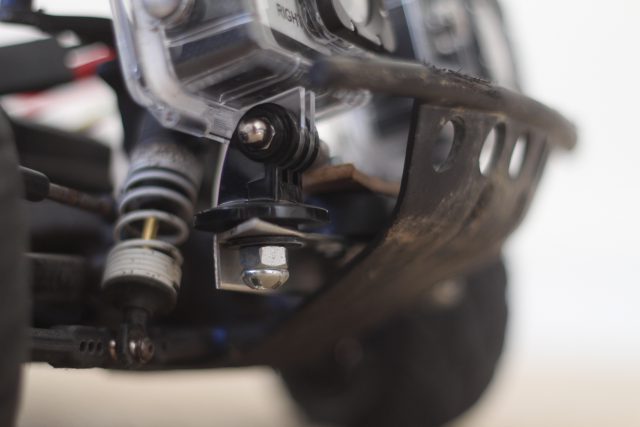
Over the past week I’ve built a mount on my RC car to hold two GoPro (or in this case, GoPro knock-offs). As I’m normally a digital artist, it was a fun and interesting experience re-learning how to use power tools like the drill press, band saw and other tools to rig up a mount to my rc car without actually modifying the car too much. The only permanent change applied to my car was cutting the front bumper to be shorter (it used to cover the lens).

After the mount, I started learning how to create stereoscopic 3D video for youtube, which was simpler than I thought. All I had to do was align the two video files time-wise, and then squeeze them into one frame so they were side-by-side (height = 100%, width = 50%). The 3D works really well, despite the lenses being wide-angle and the cameras being farther apart than human eyes. The only true problem is when an object is very close, it becomes dizzying to try to focus on. But the wide distance between lenses helps really emphasize the 3D depth for farther-away objects, which is good for wide-angle footage (as objects look farther than they are).

Here are some test videos- best viewable on a Google Cardboard or similar VR platform:

https://www.youtube.com/watch?v=GlGtOXn6Gcs

https://www.youtube.com/watch?v=6AHTyUfjFA0

https://www.youtube.com/watch?v=iNgsHt4coFA

Here are some ideas for me to film later:

hizlik- EventProposal

https://www.youtube.com/watch?v=zvDXlDxMnb4&t=43s

After Golan showed Rendevous piece in the beginning of class, I couldn’t get an idea for a cool and unique way to remake it. I had an idea that was similar to the content of Rendevous, but with a twist that hopefully will shock the audience.

I would create a similar aesthetic to Rendevous by mounting a camera with a medium-narrow FOV very low on the front bumper of a car. Initially I would recreate the urgency and daringness of the Rendevous driver, but in reality I would have the camera attached to a small RC car (not a real car). In addition to this being a safer way to film such a task, this presents a unique visual opportunity to “play” with the audience. They think a real car is being used, so I would start presenting situations that hopefully should scare the audience. For example, speeding down a city lined with parked cars and driveways and suddenly a car reverses from a driveway right in front of our driver! The audience thinks it’ll cause an accident but WOOSH the camera goes right under the car backing out (because it’s an RC car). After that initial reveal of this deception of size, i may use it for other things (like driving on sidewalks or through buildings). Then when the car reaches it’s final destination, it may park in front of a reflective surface (or the driver will detach the camera and show the car) to show that it was a full-size vehicle all along.

An addition to this idea would be to also make it in stereoscopic video (using two GoPros for example to create a paralax effect) and watch this film in VR (as well as a 2D version for online sharing). I’ve never done that before, and would be interesting to both build the setup and edit it.

Of course, if Golan deems this project not “experimental enough” then I will come up with a few more ideas. I don’t have any others right now because this has taken up all my thinking, as I’m very excited for a potential opportunity to make such a choreagraphed video (and I always like incorporating my RC car into projects).

hizlik- Place

Update: As of 2020, an updated documentation for this project is now on my website at hiz.al/mexico.

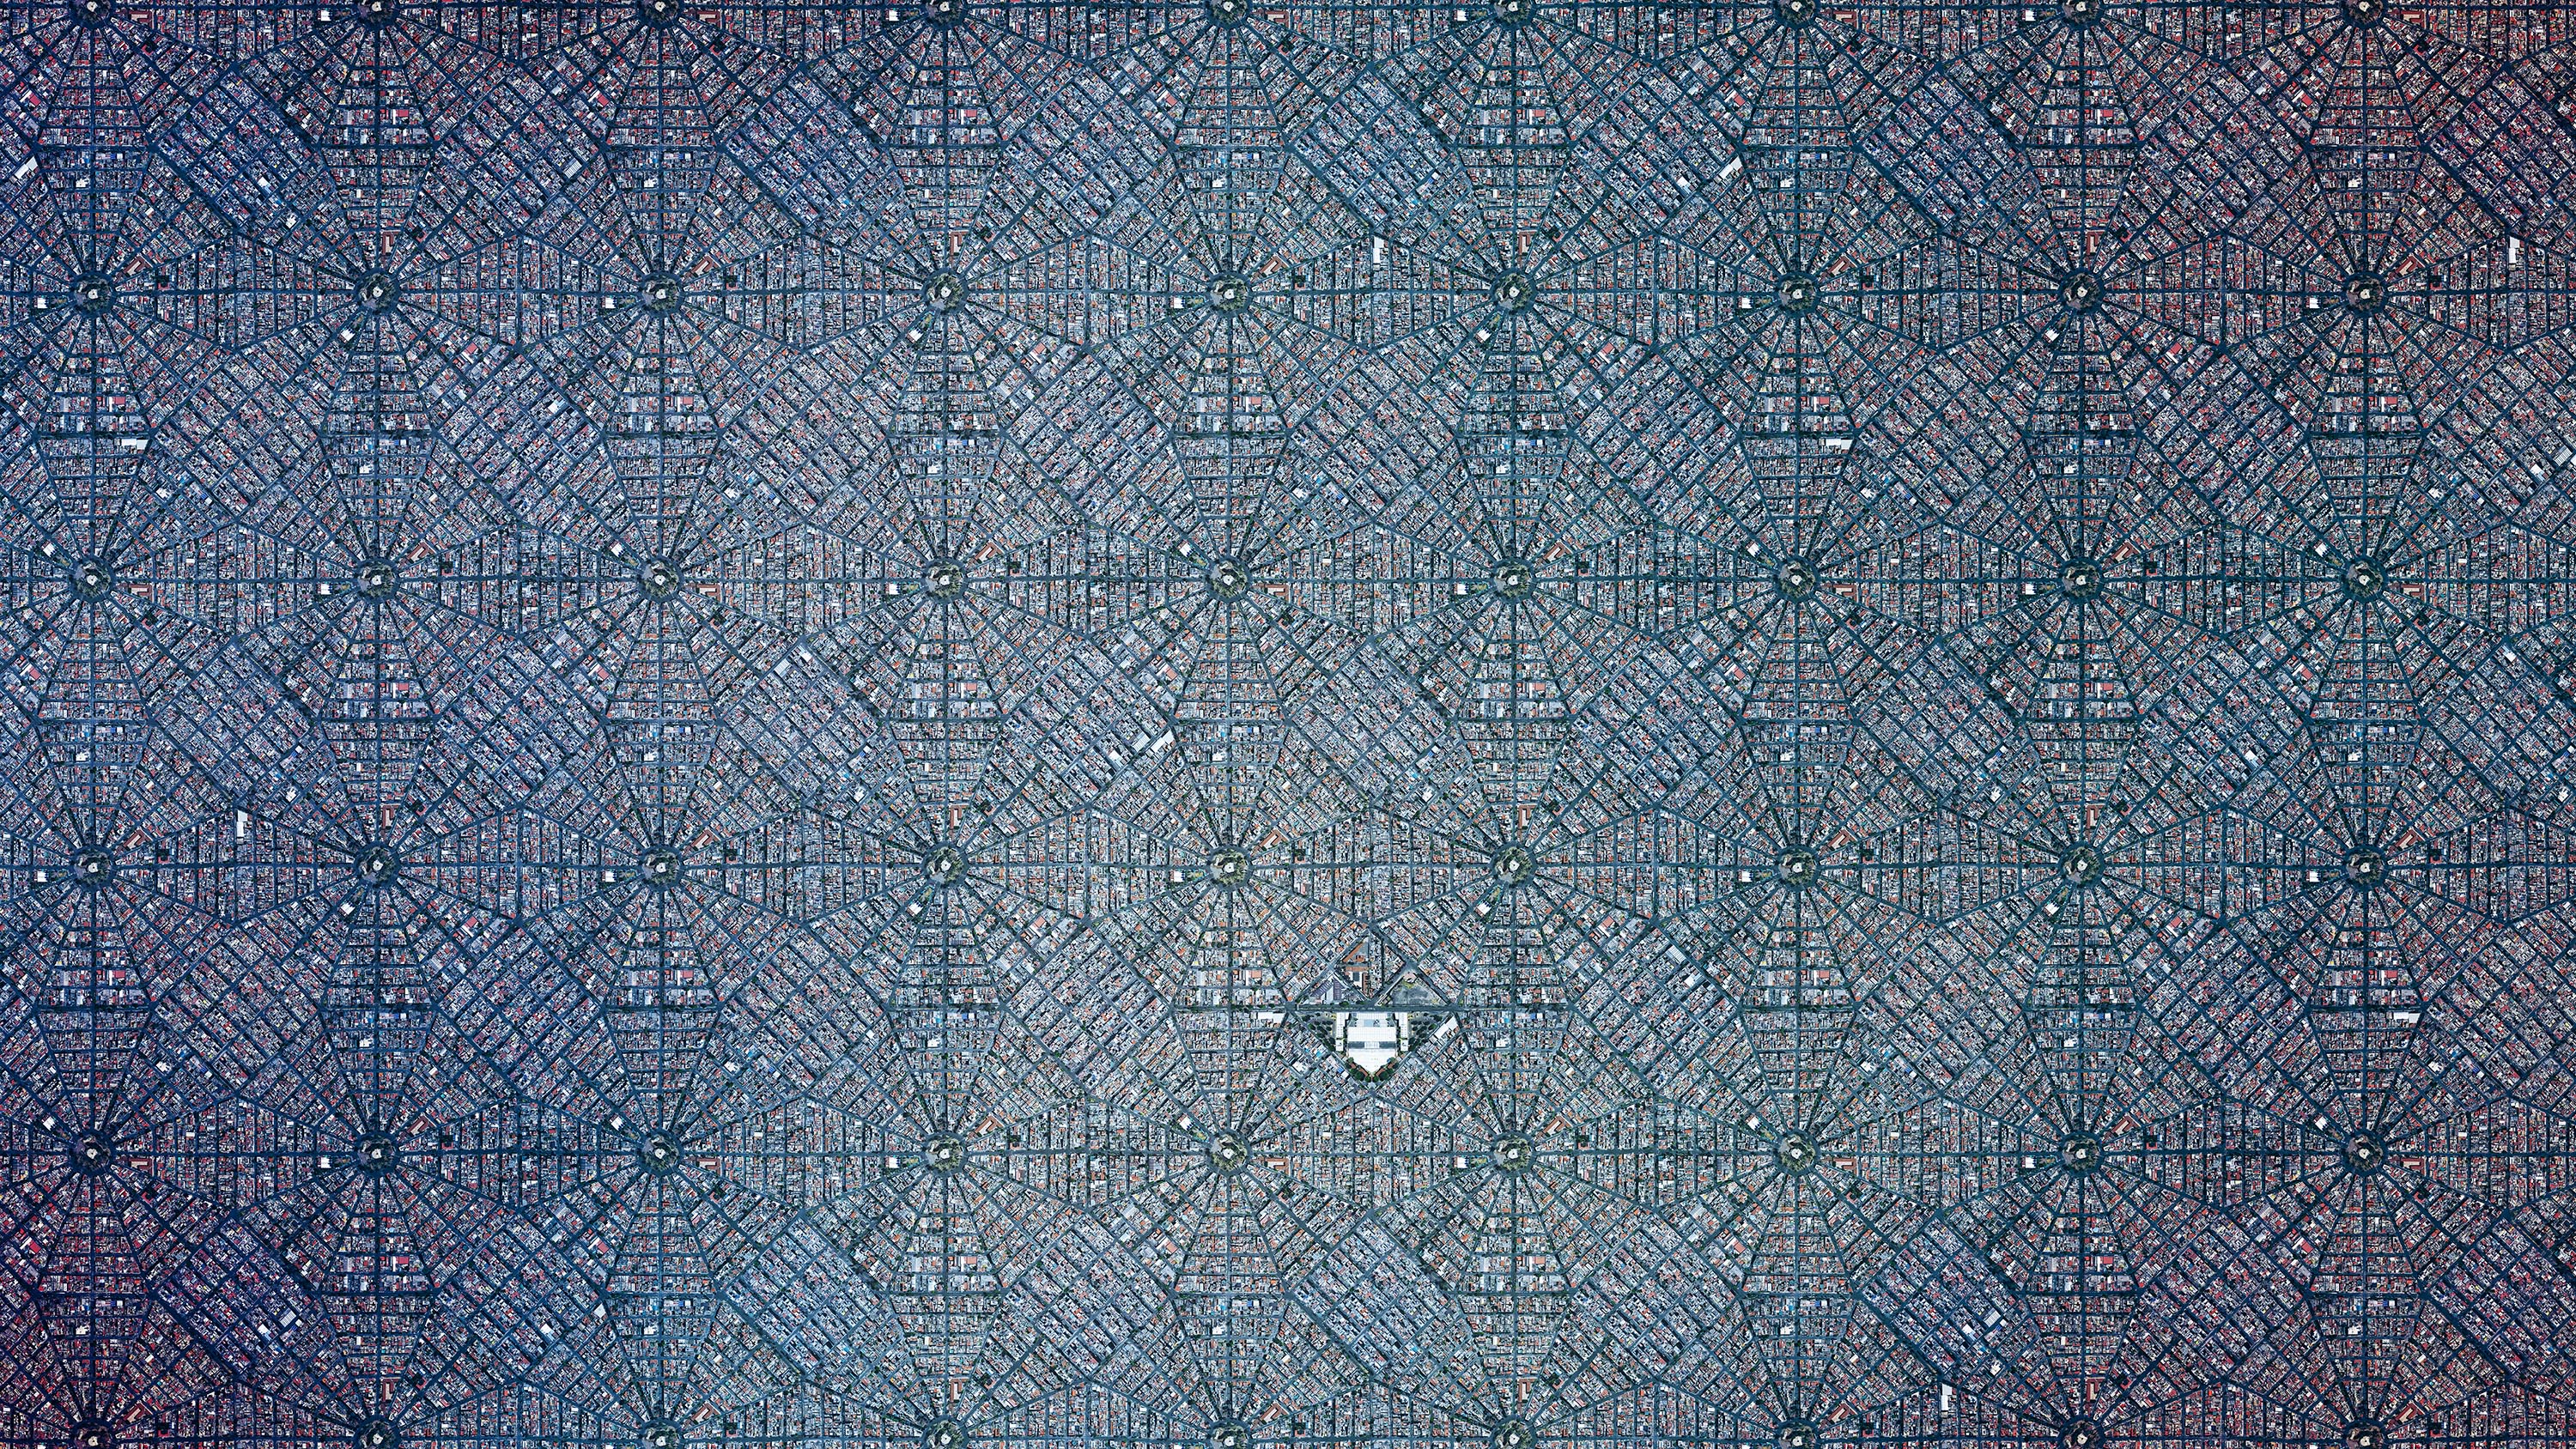
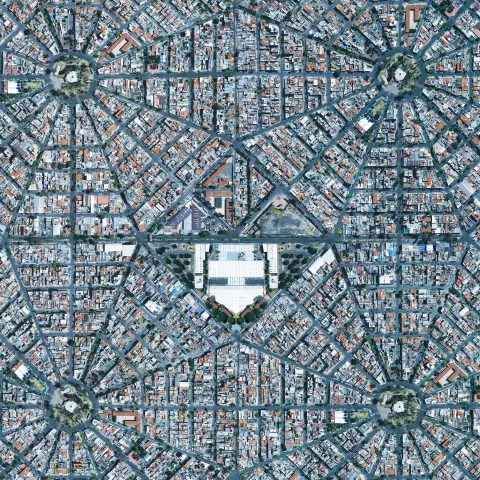
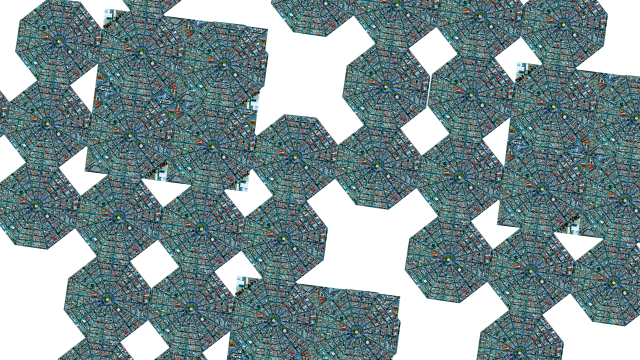
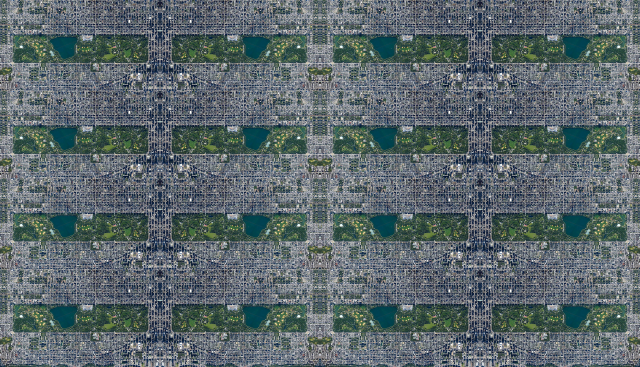
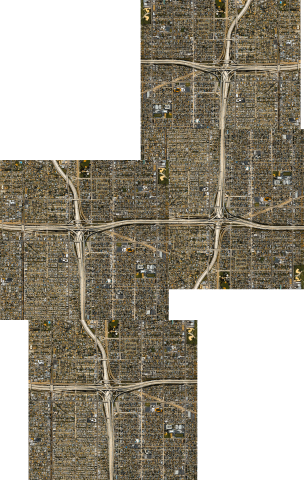
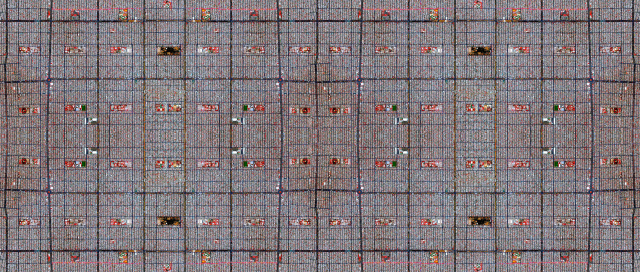
For this piece I searched all over the world for interesting patterns viewable from a birds-eye perspective. My tool of research included Google Earth and a few “aeronautical photography” compilations on the web with interesting ideas for locations. Below, you can find some of my other tests of locations, but for the final piece I decided to go with a subsection of Mexico City. I chose this because it was geometrically compatible when duplicated, and there were plenty of nearby locations in Mexico City with appropriate “filler textures” that could help reduce the replicated/patterned look of the final composition, and allow for some randomness and uniqueness. I also found the octagonal shape to be quite pleasant to look at.

Final Image

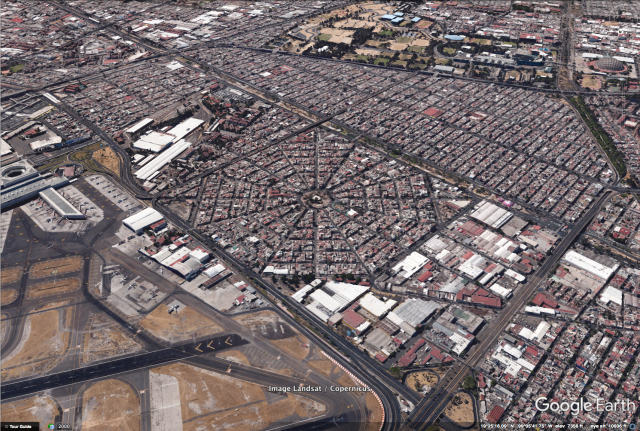
In order to create this piece, I first used photo stitching (using tools similar to AutoPano to stitch multiple photos together to create one large hi-res image) to create a high resolution rendering of the “square”. I scanned it top-down block-by-block to gather the screenshots to be stitched. Here is the original location in Mexico City:

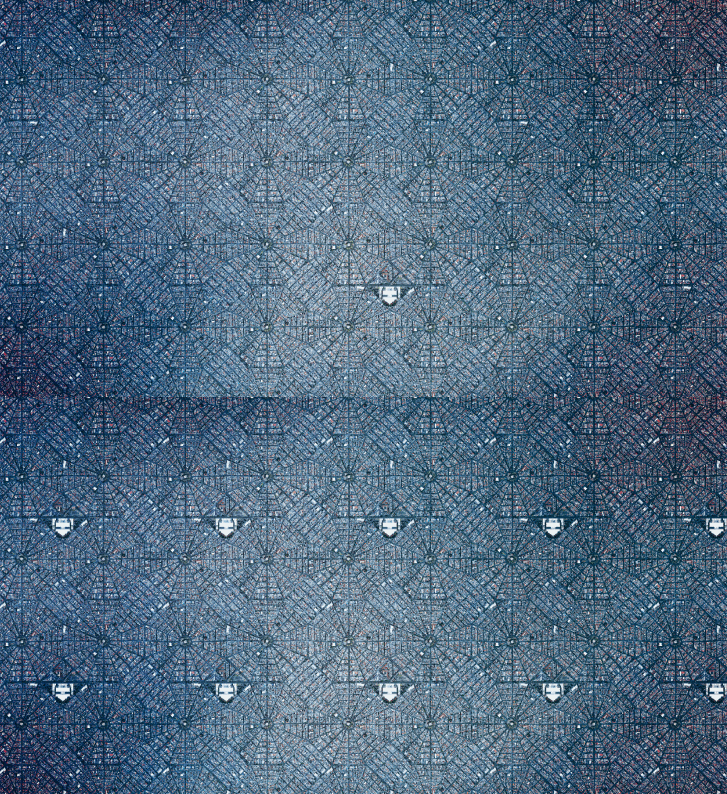
After creating the stitched image, I started duplicating it and rotating it (to break up patterning) manually, in an ever-expanding state. I filled gaps in with other parts of the city and blended any seams manually as best I could. Here is a close-up of the block duplicated 4 times.

After creating the composition, I started going in and finding obviously repetitive locations and clearing them up to be more unique. Unfortunately I did not have time to finish this process, and I didn’t have the chance to change the center of each octagon (the most obvious repetition at this state), as well as other small locations. Here’s a gif portraying the before/after of the “cleaning” I did:

Lastly, after giving the entire image a overlaid texture to simulate different lighting conditions (from clouds/atmosphere) and scale, I animated a short video using Premiere, to demonstrate the detail that you can zoom in to. The final form of my project is a 2D image, preferably printed to a very large scale so the audience can look at it from afar, or walk closer to it to see detail. The video was meant to replace that for digital purposes. Unfortunately, the final image is too large to be uploaded online (500MB jpeg file).

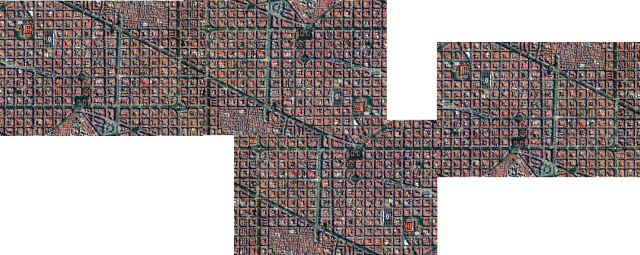
If I had time, I would do more locations and perhaps automate (write a computer script) to generate infinitely expanding versions of cities. One such city I think would be most suitable for computer-generated cities would be Barcelona, as seen below.

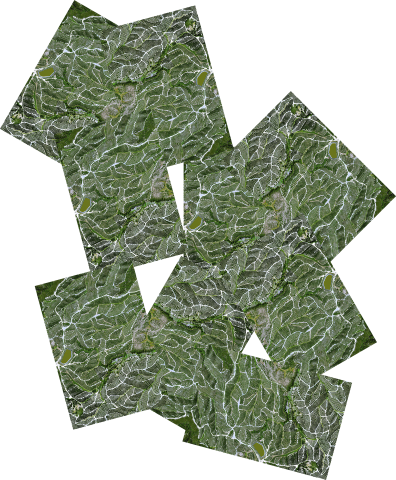
Here are some other locations I considered, and my preliminary patterning:

Mexico City

Barcelona

France

N.Y.C.

L.A.

Mexico City

hizlik- PlaceProposal

I still haven’t decided on a place yet, and honestly haven’t quite decided on a technique yet either (I may do multiple techniques). I will list my ideas as such:

  • A “panorama” stitched together consisting of photos of the side of a building. However, the photos will wrap completely around the building (walking sideways while taking them), somewhat “unwrapping” the building I’m photographing by the end of the project. This could be a building or some other significant space
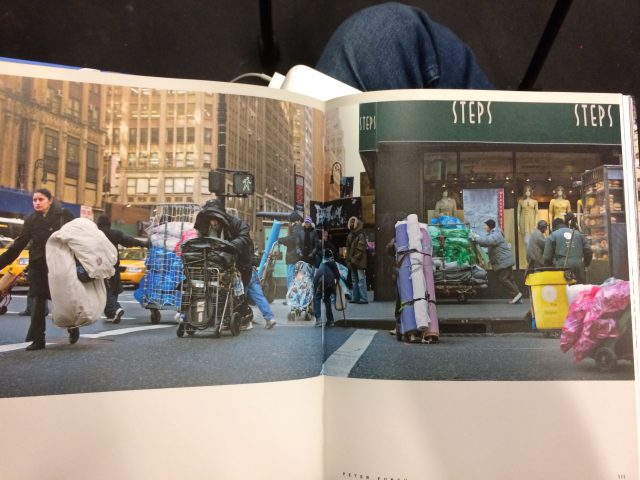
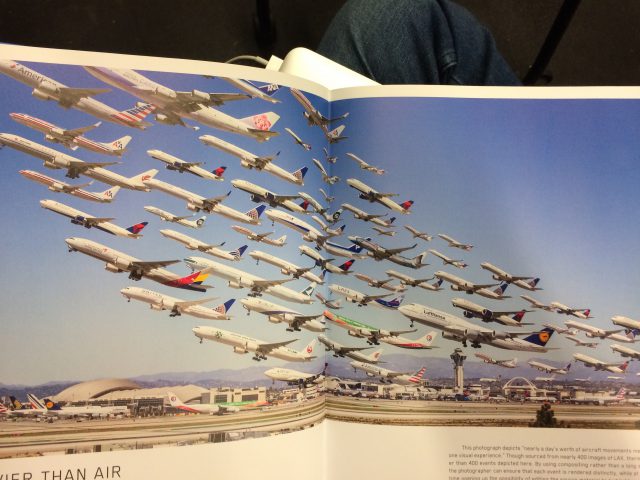
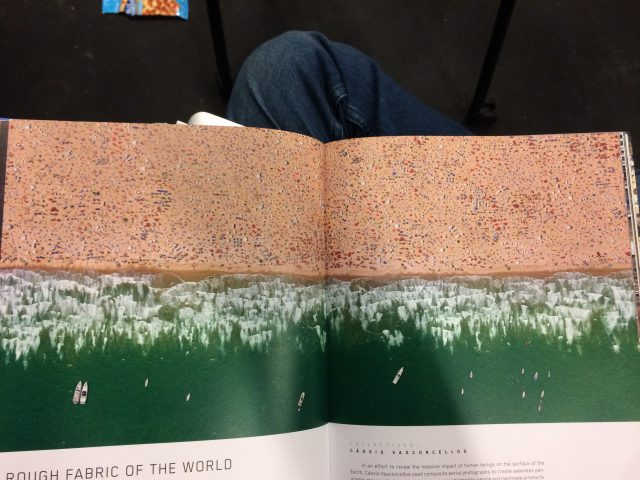
  • A photo-collage protraying a significance or pattern, or just looks cool, similar to the images below. I was thinking maybe some pattern amongst students walking along campus, or some off-campus location as well (but with enough “traffic” of people, vehicles or animals to make it a viable location to collage).
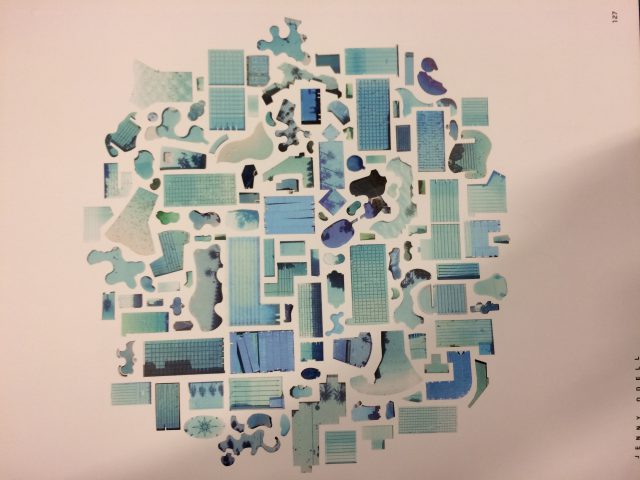
  • A collage of “cut-outs” of significant or cool-looking landforms, buidlings or other repeating places and patterns using Google Earth or maps, such as this collage of pools:
  • Or some idea stemmed from those above

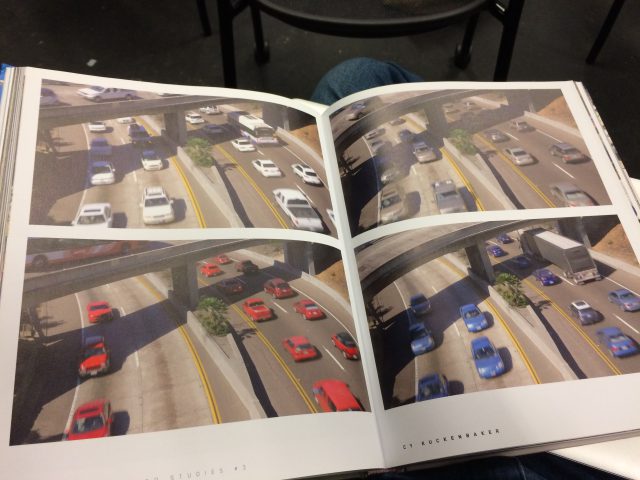
All images are from the book Photoviz.

hizlik-Portrait

Update: As of 2020, an updated documentation for this project is now on my website at hiz.al/photodata.

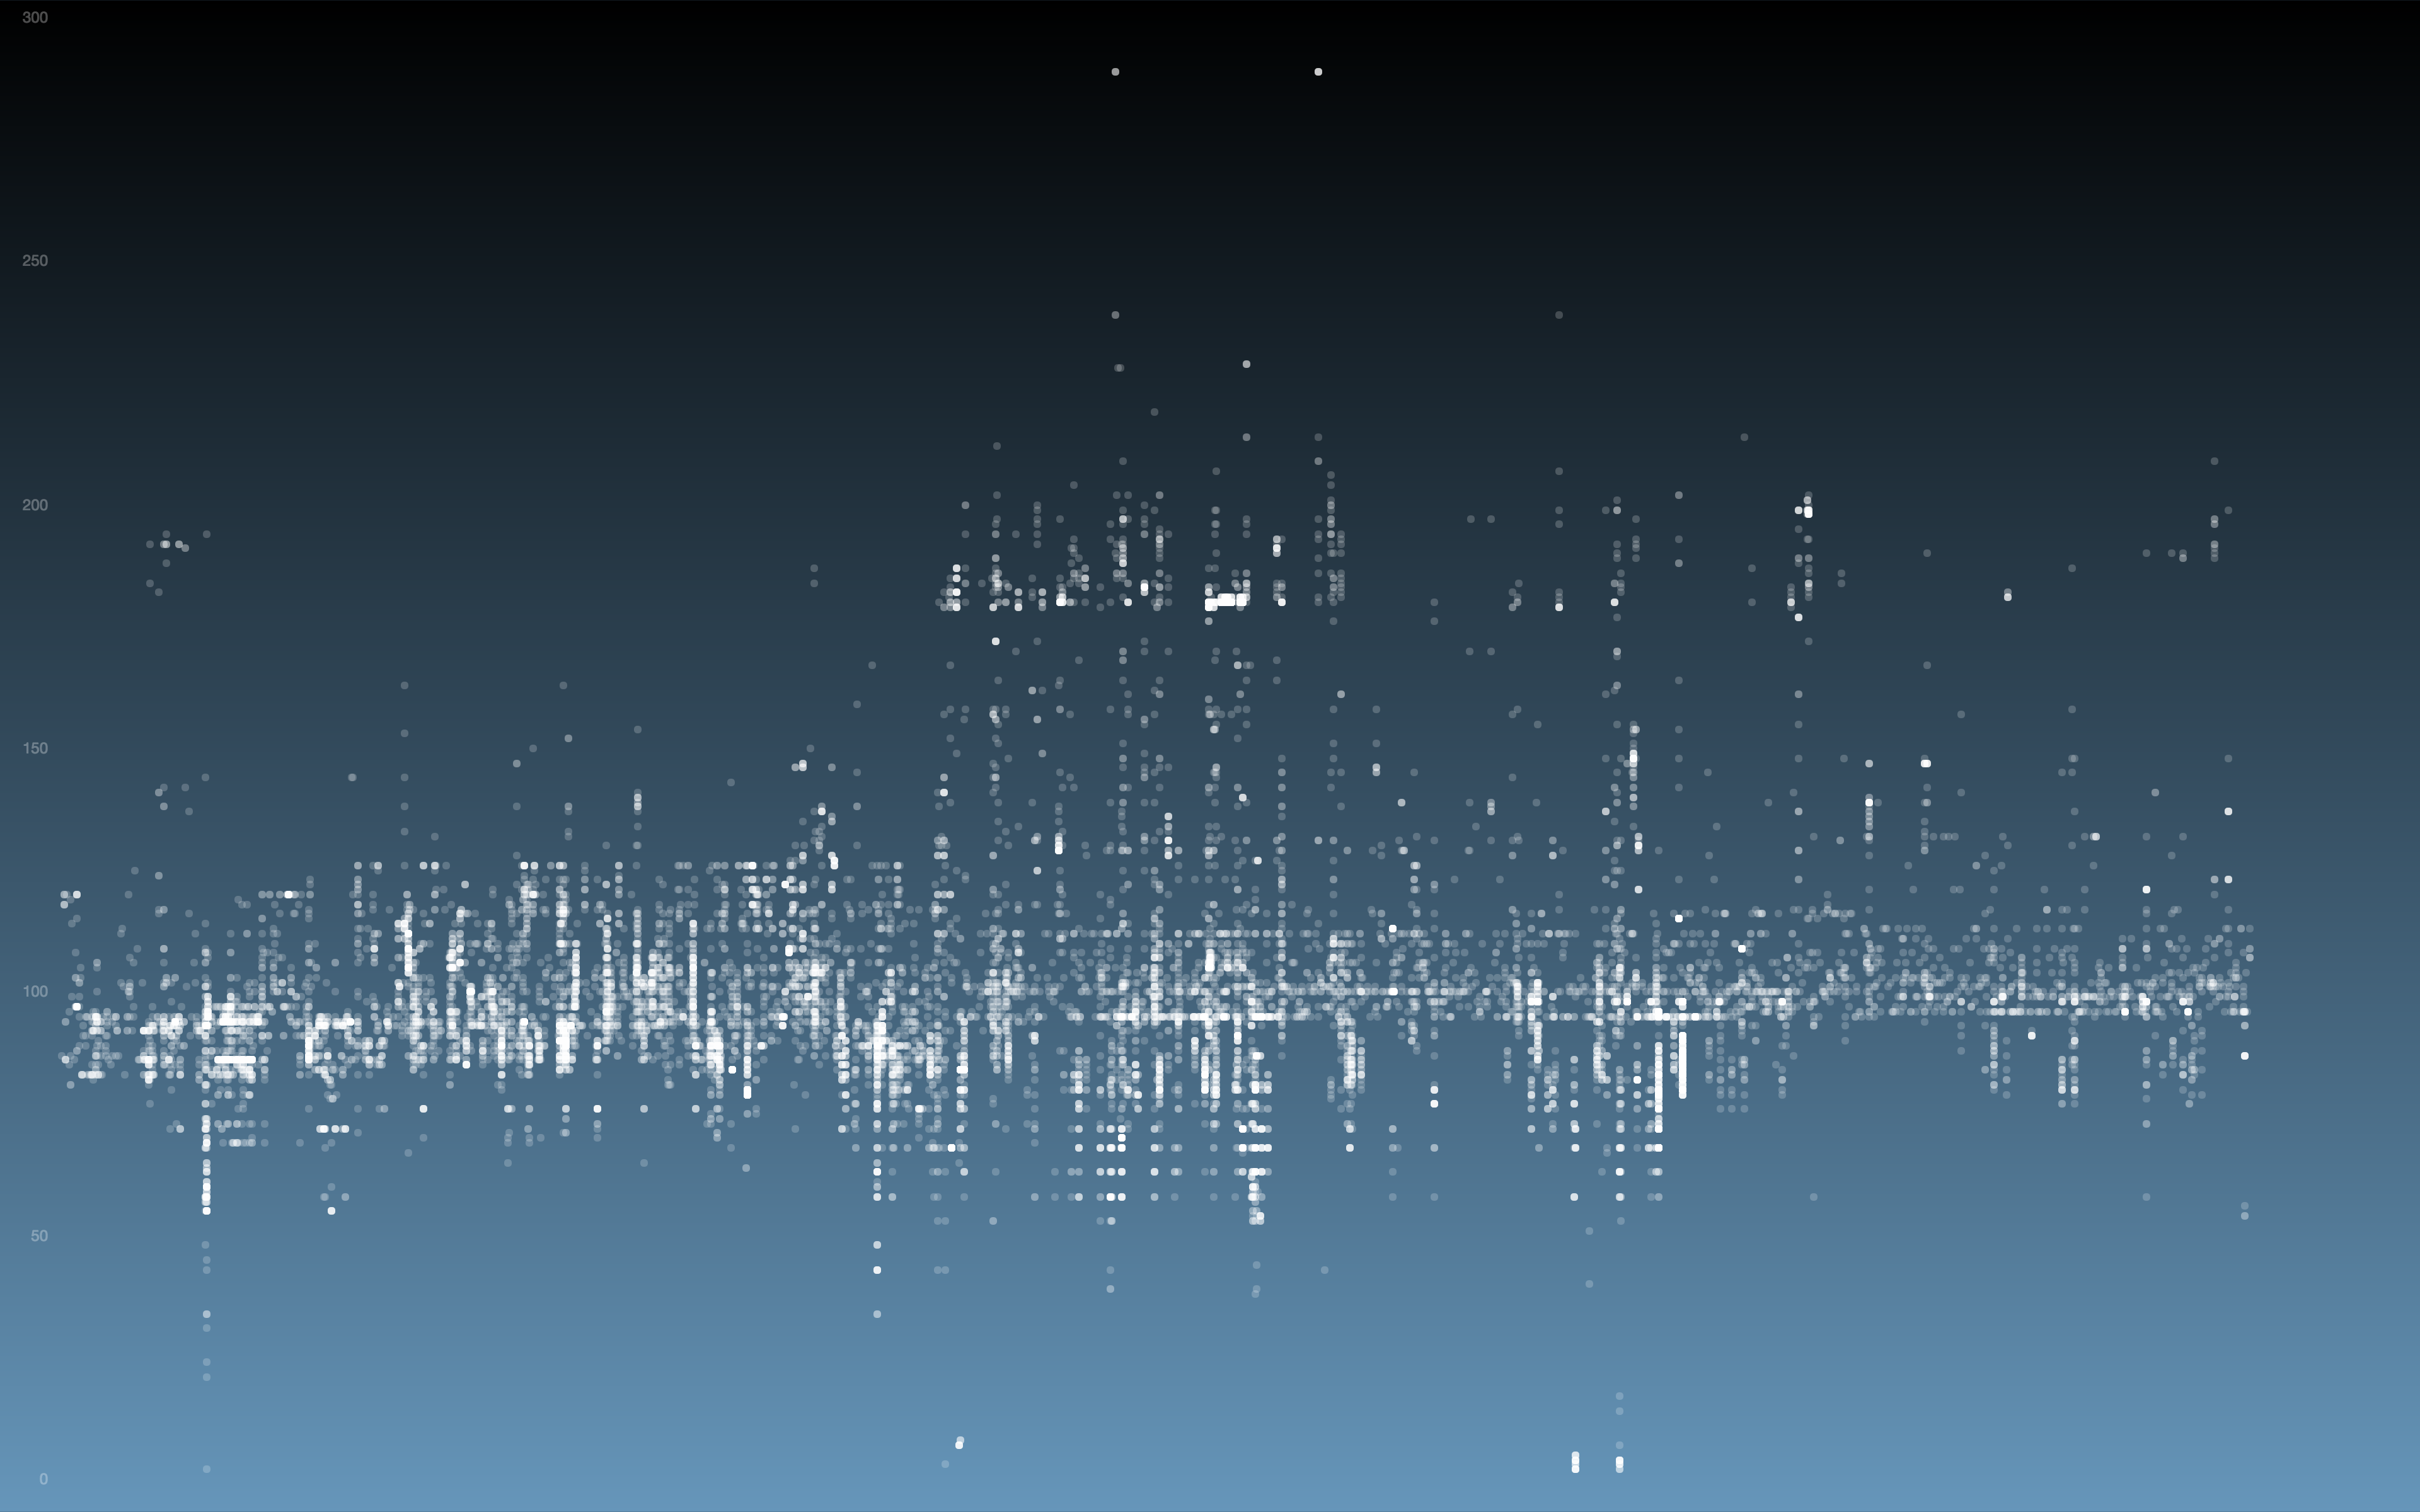
After meeting Quan and getting to know each other, we discovered we wanted to make a portrait of each other based on our preferences as photographers. We wanted to compare styles, subjects, etc. We came up with a bunch of ideas, and settled on using metadata to create data-driven visualzations of our preferences. We also orignally wanted to use Google’s Vision app to interpret what the subject of the photos was, but that turned out to be too slow/complicated. Instead we focused on core aspects of our photographic styles. For example we wanted to know how we compared based solely on aperture and focal length preferences, as Quan has special lenses and I prefer using a single 50mm prime lens. We also wanted to see what kinds of ambient light we photographed in, and how that compared to what we thought of ourselves. I’m surprised, because I usually think I’m an indoor photographer, but a lot of my photos turned out to be daylight-level ambience.

Quan has about 90k images and I have about 25k images. The process for Quan was a bit longer than me since he stores his images as RAW files, but for it to be easier on us we decided to convert his images to small JPEGs with metadata intact, and read it into the python script below. As for my images, the count is because I clear unneeded images and generally can reduce a photoshoot of about 700-900 photos down to 50 photos to be kept. All my photos are already in JPEG so I didn’t need to convert anything (a process that took over a week for Quan). After conversions, the python script grabbed the necessary metadata (time, focal length, shutter speed, aperture, etc) and computed the data for the four visualizations below. For ambience, we made a rating-based system comprised of a combination of aperture, shutter speed and ISO to create a number that represented the overall ambient light that the location must have had (instead of the actual brightness of the photo).

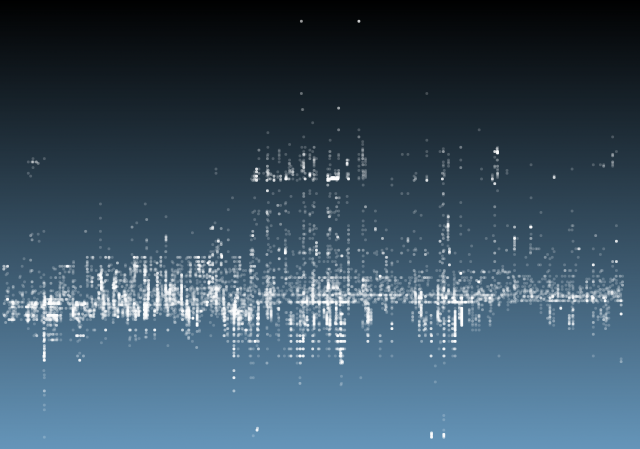
After the data is created, it is saved to js files and read into various HTML pages and loaded into Chart.js charts to create the visualizations below. Quan, since he didn’t write as much code, also made a second project visible on his page. For the ambience ones, each dot represents an image, and each image has a certain amount of transparency. The brighter the white, the more the images during that day, in that lighting.

Ambience (Hizal)

Ambience (Soonho)

Focal

Aperture

(the following code was adapted for the various analysis above)
Python Script: Analyze metadata from 120k images for ambience


from collections import OrderedDict 
from os.path import exists, join
from datetime import datetime
from os import makedirs, walk
import logging, traceback
import exifread
import json

debug = False
default_folder = "imgs"
extentions = ('.jpg','.jpeg','.png','.tif','.tiff','.gif')
files = []
metadata = {}
days = {}
data = []

def load(folder = None):
  global files
  if not folder:
    folder = default_folder

  for r, dir, f in walk(folder):
    for file in f:
      if join(r,file).lower().endswith(extentions):
        files.append(join(r, file))

  perc = 0
  count = 0
  for file in files:
    if debug:
      print file

    image = None
    while not image:
      try:
        image = open(file, 'rb')
      except:
        print "ERROR: File not found: " + file
        raw_input("Press enter to continue when reconnected ");
    
    tags = exifread.process_file(image, details=False)  
    try:
      # timestamp
      ts = datetime.strptime(str(tags['EXIF DateTimeOriginal']), '%Y:%m:%d %H:%M:%S')

      # aperture
      fstop = str(tags['EXIF FNumber']).split('/')
      if len(fstop) > 1:
        f = float(fstop[0])/float(fstop[1])
      else:
        f = float(fstop[0])

      # shutter speed
      speed = str(tags['EXIF ExposureTime']).split('/')
      if len(speed) > 1:
        ss = float(speed[0])/float(speed[1])
      else:
        ss = float(speed[0])
      
      # iso
      iso = int(str(tags['EXIF ISOSpeedRatings']))

      # focal length
      mm = str(tags['EXIF FocalLength']).split('/')
      if len(mm) > 1:
        fl = float(mm[0])/float(mm[1])
      else:
        fl = float(mm[0])

      if debug:
        print "\tTimestamp: " + str(ts)
        print "\tAperture: f" + str(f)
        print "\tShutter: " + str(tags['EXIF ExposureTime']) + " (" + str(ss) + ")"
        print "\tISO: " + str(iso)
        print "\tFocal length: " + str(fl) + "mm"

      metadata[file] = {'f':f, 'ss':ss, 'iso':iso, 'fl':fl, 'ts':ts}

    except Exception as e:
      if debug:
        print file
        logging.error(traceback.format_exc())
      pass

    # print progress
    if count == 0:
      print " 0% ",
    count += 1
    new_perc = int(round(((count * 1.0) / len(files)) * 100))
    if new_perc > perc and new_perc%10==0:
      print "\n" + str(new_perc) + "% ",
    elif new_perc > perc and new_perc%1==0:
      print ".",
    perc = new_perc

  print ""
  print str(len(files)) + " files found.\n"

def write():
  filename = "data.js"
  if debug:
    filename = "debug.txt"

  print "Writing " + filename + "... ",
  with open(filename, 'w') as f:
    f.write("window.chartdata = [\n")
    for day in data:
      f.write("[")
      for i in xrange(len(day)):
        f.write(str(day[i]))
        if i != len(day)-1:
          f.write(',')
        else:
          f.write('],\n')
    f.write("];")
    f.close()

  print "\t\tdone."

def map(value, srcMin, srcMax, tgtMin, tgtMax):
  return tgtMin + (tgtMax - tgtMin) * ((float(value) - srcMin) / (srcMax - srcMin))

def constrain(value, min, max):
  if value < min: return min if value > max:
    return max
  return value

def getRating(meta):
  iso = constrain(map(meta['iso'], 100, 6400, 0, 100), 0, 100)
  f = constrain(map(meta['f'], 22, 1.4, 0, 100), 0, 100)
  ss = constrain(map(meta['ss'], float(1.0/8000), 1, 0, 100), 0, 100)

  if debug:
    print "\tISO: " + str(meta['iso']) + "/" + str(iso)
    print "\tF: " + str(meta['f']) + "/" + str(f)
    print "\tSS: " + str(meta['ss']) + "/" + str(ss)

  return int(iso + f + ss)

def analyze(index = None):
  global metadata, data, days

  count = 0
  perc = 0
  for img in metadata:
    meta = metadata[img]
    rating = getRating(meta)
    if debug:
      print ""
      print img
      print rating
    if rating >= 250:
      print img

    if str(meta['ts'].date()) in days:
      days[str(meta['ts'].date())].append(rating)
    else:
      days[str(meta['ts'].date())] = [rating]

    # print progress
    count += 1
    new_perc = int(round(((count * 1.0) / len(metadata)) * 100))
    if new_perc > perc and new_perc%10==0:
      print str(new_perc) + "% "
    perc = new_perc

  # save as ordered days
  ordered = OrderedDict(sorted(days.items(), key=lambda t: t[0]))
  for day in ordered:
    data.append(ordered[day])

  if debug:
    print days
    print ordered
    print data

  print str(len(metadata)) + " files processed."

def test():
  pass

while True:
  print "0: Exit (without saving)"
  print "1: Auto"
  print "2: Load"
  print "3: Analyze"
  print "4: Save data"
  choice = (int)(raw_input("> "))

  if choice == 0:
    break

  if choice == 1:
    load()
    analyze()
    write()
    
  elif choice == 2:
    folder = raw_input("Folder section: ")
    load(folder)
  elif choice == 3:
    analyze()
  elif choice == 4:
    write()
  elif choice == 626:
    test()
  else:
    print ""

  print ""

hizlik-PortraitPlan

For this project I am working with Quan. After getting to know each other and brainstorming many ideas that were either general or specific to each other’s interests and attributes, we settled on the idea of creating a portrait of us through our portraits of the world- meaning, we are both photographers and we want to use the metadata and other information available in our photography to paint a picture of how we photograph the world, what our interests/habits are when it comes to photography, etc.

We are still coming up with variations and implementations of our settled subject, but one that we are sure to do is crating an “illumination portrait,” a visualization of the lighting conditions we generally shoot in based on a value obtained from the aggregate of shutter speed, aperture and ISO (grabbed from the EXIF data of all available .jpg images). An example of my portrait, below, is from the 20k+ images on my computer. Quan, who’s photo count is much higher he never deletes any photos) is currently converting all RAW images to jpg for analysis, hopefully to be done within the next few days.

Another idea involves running our images through Google vision to get an idea of the subject matter, however this gets very tricky on multiple levels. Some problems we’ve run into for this idea are:

  • Google vision spits out too many variations of subjects, and often don’t align with “photography categories”
  • Google vision will cost a lot of resources (time, money) to run all of our images through
  • Sometimes it is wrong. Or weird.

hizlik-SEM

Update: As of 2020, an updated documentation for this project is now on my website at hiz.al/sem.

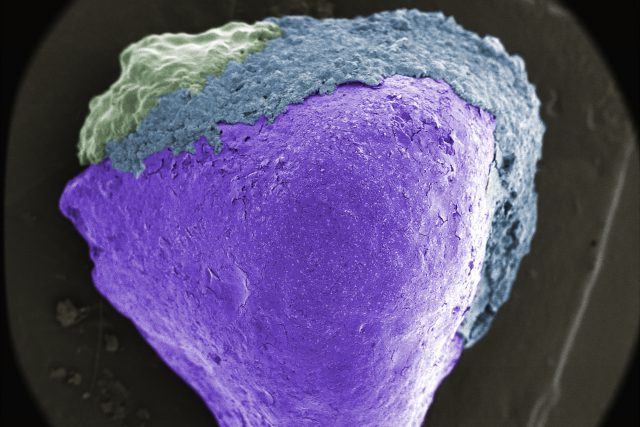
I scanned a little, purple rock picked up from the dirt of a potted plant within Zebra Lounge in the CFA. I learned quite a few things during the scanning. For example, slightest vibrations in the building itself can blur or skew scans! Also, in addition to the scanner using electrons rather than optical imaging, the reason why something at this scale has no color is because it is smaller than colored light itself! For example, purple (the “smallest color” in terms of wavelength, has a wavelength of 400nm, while our scans could be as little as 10nm! I also learned that she needs to add a special liquid to function as a “ground” for the electrons that don’t bounce pack, to prevent static/unintended “light” in the images.

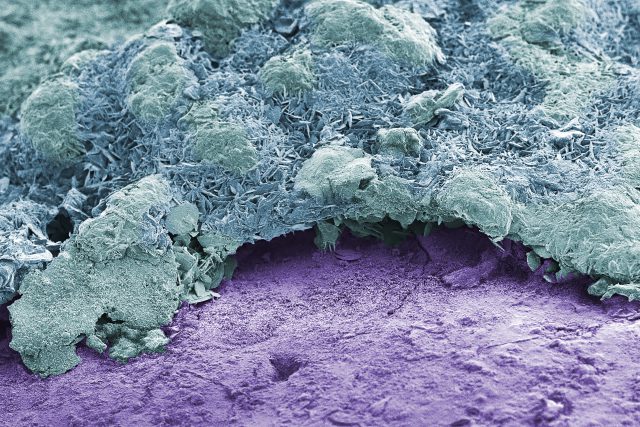
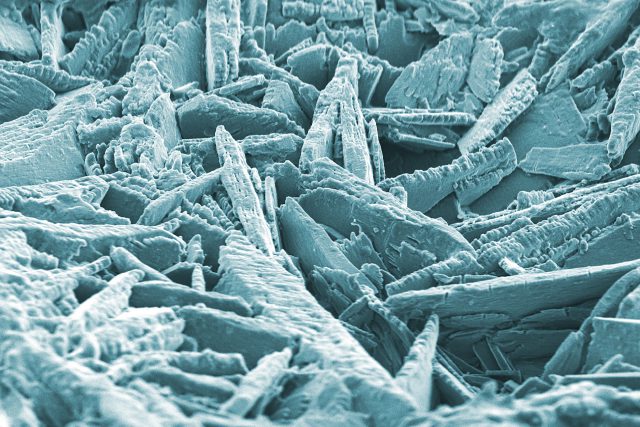
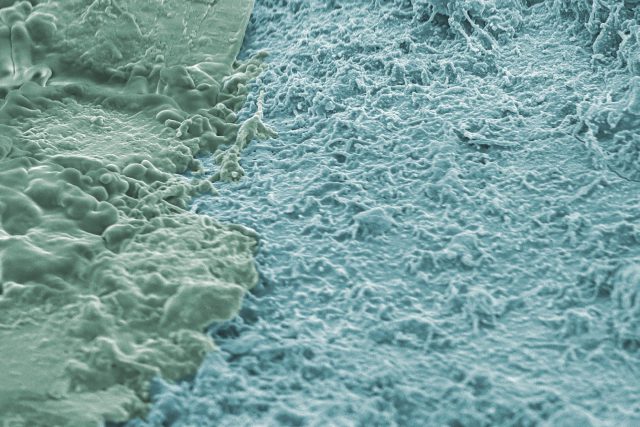
As I scanned the rock in the lab, we found a lot of interesting little things on it. Aside from the expected cracked paint, we found what could be carbonate crystals, possibly from the plant itself. The image above is an example of the carbonate build-up on top of the paint, and below is a close-up view of the crystals.

and it looks like we also found some bacteria colonies (below). The left shows a possible mucus excreted by the bacteria to “contain” them in a moist environment.

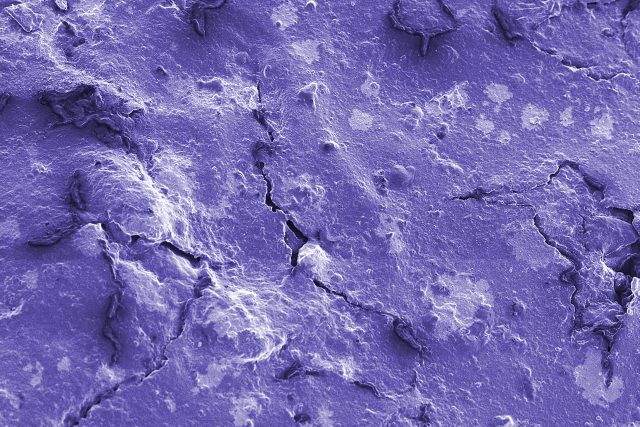
Here is a view of the paint cracks:

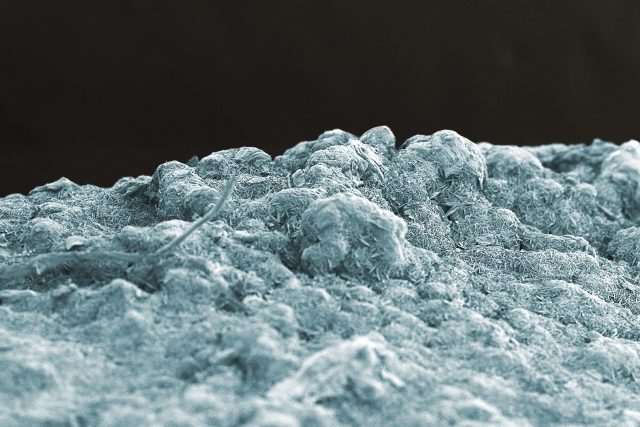
Here is the edge of the rock, near the top where there may be carbon buildup. It creates a sort of landscape:

And a zoomed-out view:

hizlik- about me!

Hi all, I’m Hizal and I’m a third-year pursuing a BFA with a minor in Software Engineering. You can get a taste of my work by visiting my website or my vimeo page! I love photography, videogragraphy and editing, animation, interactivity, game-making and all things webapps/web design!