Looking Outwards: Coding and Fabrics

Discuss one project that you admire (why?),

Dreamlines is a project created by Leonardo Solaas which creates unique, almost surrealist paintings based off of keyword users input into the form. The piece uses related images taken from the internet and merges and renders them into a new composite image, a painting. The project uses a combination of Processing and PHP with Flash as the user interface. The Processing reads images sent from the PHP and uses them to generate a drawing that is constantly changing.

What I really like about this piece is how dynamic it is. The paintings created from the searched words are constantly changing, utilizing an aspect of the internet and technology that I feel is sometimes overlooked: its constant changing and updating. In the other pieces I discuss below, the work is static despite the constant information and data being streamed into the projects and programs. However, I feel that Solaas’ piece really takes into consideration the dynamic nature of the internet and technology and this is reflected in a piece that is constantly changing and upgrading. This piece really feels interactive with an interface that like the project, is constantly moving. Another thing I really admire about this piece is its accessibility. A lot of times art seems so constrained and detached from the public but this piece, because it is online and uses the internet especially, makes the art available to everyone, critics and spectators alike and I really like that. My only real gripe is that you have to click submit, instead of enter, to have the image be rendered.


http://www.solaas.com.ar/dreamlines/p5/

One project that surprised you (why?),

The project Fragmented Memory is a collection of large woven tapestries that works to render invisible digital information and photography through woven tapestries. However, what I found most interesting about the work is that it doesn’t only work to render the digital information on the tapestries, but to capture and store that data. Essentially the tapestries are like a combination of all the digital information in a computer’s memory expect on a physical level, represented in woven string instead of pixels and memory.

This project is especially compelling to me because of the concept of physically representing digital information. Through this project they were able to make data, something so seeming ethereal and elusive tangible. In order to visualize memory they extracted Phillip Stearns’ physical memory from his computer. They converted the data into images using custom software written in Processing which grouped the six bit info into RGB colors.

In the comment section of Phillip’s page, I noticed an interesting comment that left a link to a BBC program. In the program it linked computers to looms, essentially noting the close relation of the information processing to the looming process. I think that was a really interesting connection to computers and fabrics. Learning of this connection really added another layer of depth to the piece.

http://phillipstearns.wordpress.com/fragmented-memory/


And one project that missed an opportunity (why?).

News Knitter is a projected created by Ebru Kurbak and Mahir Yavuz which converts news feed of a certain day or period into visualized text and data that is then printed on a sweater. Like the looming project I mentioned before, this is another project which uses computer data and converts it into garments. The project uses processing to convert the constant news feeds into visual representations which is then sent to knitting machine which creates the sweaters. I really like the concept of the project and the overall execution. If you look below, you’ll see that the sweaters the program prints are visually appealing, especially with its striking blues, reds and blacks which are very akin to the colors we see in political spheres.

000nk_sweaters_full

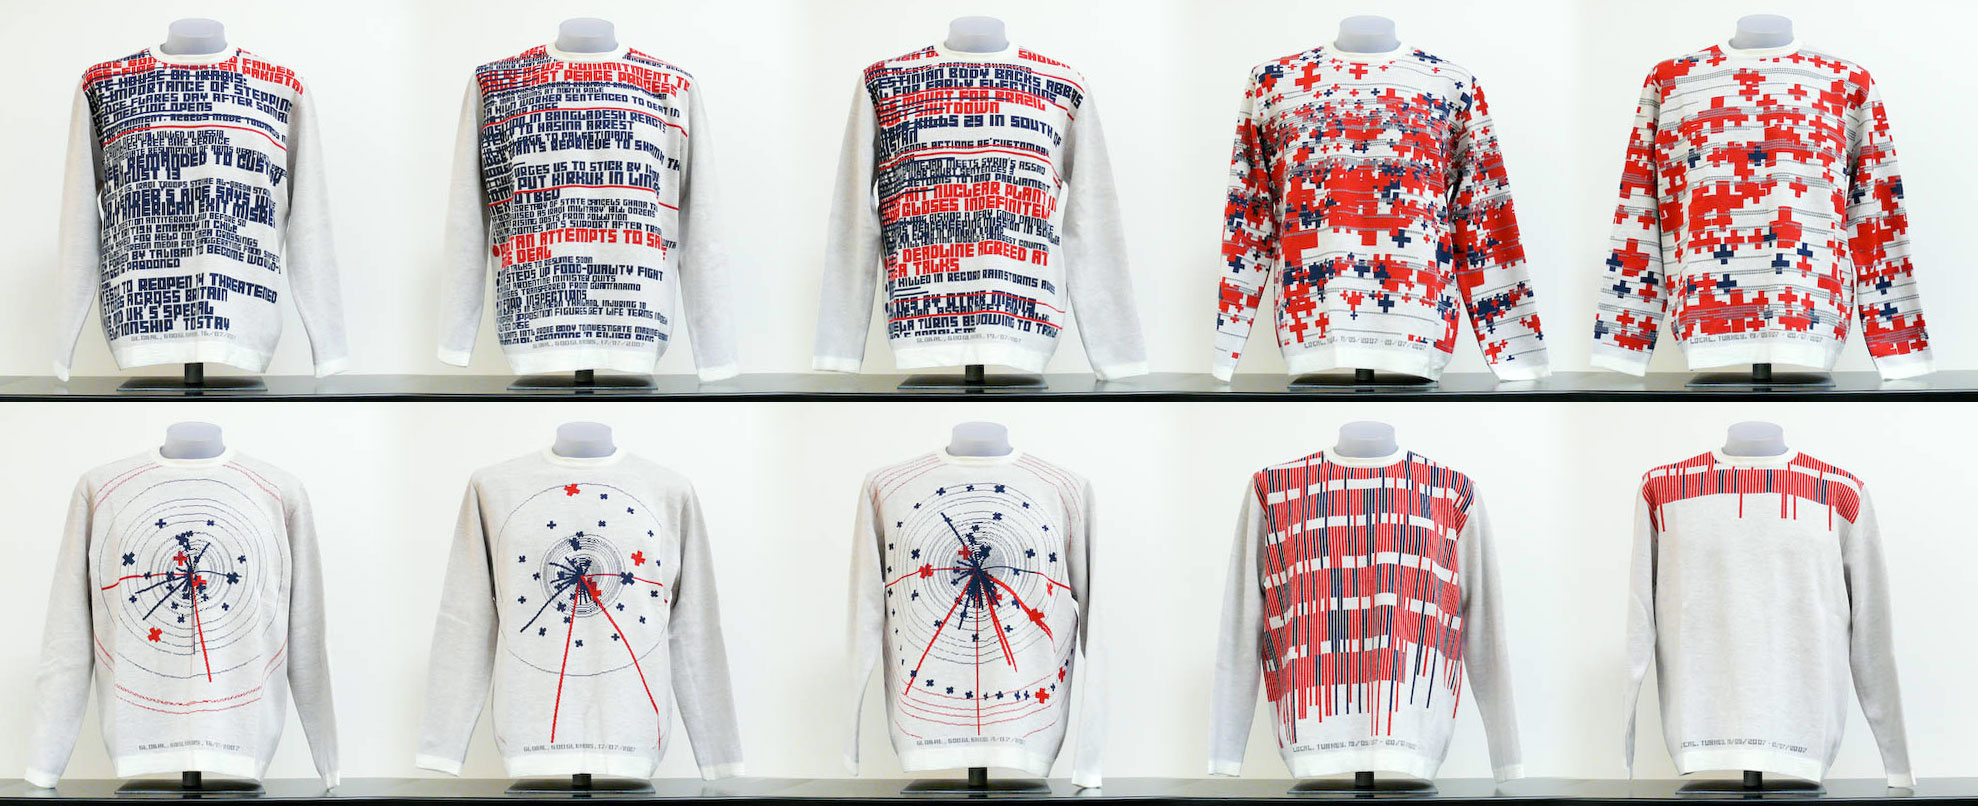
http://casualdata.com/newsknitter/images/nk_sweaters_full.jpg

Despite this, I find that the process in which the information is selected and filtered isn’t explained very well or doesn’t appear to reflect very much in the overall pieces. The sweaters have streams of words or graphs, but the information it is trying to convey is lost because of the fact that there doesn’t seem to be a filter in which the news is selected. I feel like this is one of those cases where because they are selecting from so much information and not really seeming to do much to filter or organize it, it doesn’t mean very much. I think this project could be more effected if the sweaters and news were categorized in some way. If they could filter out all the news regarding one subject, Israel and Palestine news for instance, and create a series of sweaters based off that news for the day, and so on, then the information being conveyed from the sweaters would have more impact. However, right now they are simply just a series of sweaters that relay old news.

http://casualdata.com/newsknitter/


IF and then recipie

So for my IFTTT account I created a recipe which I vaguely understand how it works. Not being a very frequent Instagram user, I created a recipe that might interest me in the app more. Basically how it works is every time I like something on Instagram (I’ll make an effort to actually use the platform), it will update my profile picture on twitter. This recipe was mostly a test recipe to see what results I would get from IFTTT. I’m chronicling this recipe and another one I’ll explain later on below for a week to see the results. In general I don’t really pay attention to social media so my hope is that if and then can serve as a surrogate me and post and like things for me. I hope to create a digital version of myself that completely functions and exists on the internet with little to no prompting from me. My second recipe will aim to do this even more by posting automatically on my tumbler whenever there is a sunrise in my area based on the weather channel app. Hopeful I will have a completely automated tumblr that posts stupid pictures of sunrises and weather updates.

I created my recipes before I read Jim Campbell’s Formal for Computer Art Post however, after reading the post it really gave me insight into how IFFTEN functions. From what I can make out, essentially the website is retrieving and sending information based on a certain set of parameters, or recipes, the user makes. All of this is based off of the open API from it and other websites like twitter and Facebook. I find API to be a form of welcomed hacking in a way, especially when it comes to retrieving secret information from the government. However, on a social media terms, I also find it slightly unsettling. Even using the website IFTTT to essentially automate tumblr posts for me is in a way unsettling. Essentially it is connecting all of the information you have on social media websites and linking them, inherently creating a completely digital database of you online which I find unsettling.

If you would like to see what IFTTT has posted for my tumblr so far, or you would like to know what the weather is today, you can check it out below!

https://www.tumblr.com/blog/ritznrubble

History in Tweets

So one of my favorite subjects ever is history. Everything I am and do is informed by my history and the history of the world around me and I just find it so fascinating. So, on that note I decided to share a post of one of the twitter accounts I follow called history in pictures. Honestly, prior to discovering this account I wasn’t a big fan of twitter, then I realized that it’s not really about following your friends or people you know, it’s about finding people who are interesting and have interesting things to say. After realizing that I found that I enjoyed it so much more.

What I love about this image is it’s just so simple and random. It’s a random image of a boy who lived in  1968, who may still be alive-I don’t know. I find images like this to be so compelling because they seem to capture their time period in some way. Pictures of people just being people, just decades before me, or centuries ago–in those cases drawing of ancient times served that purpose! You probably don’t find it as interesting as I do but I love this kind of stuff!It just makes me so much more aware of the time period that I’m living in, and the person I am now. Will this blog post still be online decades from now? Will people find this and wonder, who is that girl talking about that strange boy who existed once upon a time? All of these questions come to mind when I see images like this, concrete proof that there was something before now and that there will be something after, even when I’m not here to post about it. Take a minute and just think about that. Also look at that kid. He has a great sense of style.

Twitter

I found twitter to be interestingly different from facebook. I have been begrudgingly trying not to use it for years due to the time I’ve seen people waste on it. This is the same reason I still don’t Reddit. However, I can see how it would be helpful to use it to receive only relevant news from relevant people. It is so far much more useful than my facebook wall which is filled with pictures of people who I barely knew in high school and all of their babies.

I found this tweet interesting because it has to do with the live streaming of CTFs which are large computer security hacking competitions. I think I might be interested in bringing computer security hacking and art hacking together.

Dumb Twitter

I don’t use twitter, really, nor have I ever felt inclined to. I don’t see it as lacking a purpose, however. I actually find it to be a very serious form of social media that proves to be more useful than Facebook in terms of how we spread information and how we prefer to customize our social media experience.
However I see twitter as very successful in terms of humour, and this new form of nonsensical or clever post-4chan internet humour (I’m giving it more credit than I should, and maybe I am even wrong to assume it could be called this).
With twitter there seems to be either this push for extreme seriousness in the spread of information, or this goal to be as amusing as possible. I like to compare this to Facebook, where Facebook is this supposed more “intimate” space where all your life junk can kind of be piled up and it is completely understandable. Random pictures and status updates and links, where Twitter feels more refined and simple, yet still inviting into a person’s life and formulated persona.
I appreciate Vampire Weekend’s Ezra Koenig’s tweets, and his comments on the overlooked and everyday interactions with the internet.

IFTTT- Isabella

If my Alarm turns on, then my house phone receives a call.

I wanted to create a sort of disruption in my household, where my parents and siblings receive a reminder that I still exist, but in a form that brings them anxiety and worried thoughts. Considering I probably sleep much later than they do and they really want to forget this fact and believe that I sleep at the nice hour of 10 pm, every single time I decide to go to sleep and turn on my alarm, they are notified by two house phones ringing an 8-bit Liszt’s Liebestraum (yes, this is our home phone’s ringtone), echoing and disrupting their sleep.

I think IFTTT and API’s provide users with the means of customizing their networked experience, rather than to have a set experience that we must navigate through. But in addition to this, they allow the experience to transcend functionality and become conceptually driven as well, in reference to Thorp’s article. Campbell’s Formula for Computer Art is a means of showing the simplicity and straight-forwardness that might be assumed of Computer Art, but in this simplification he undermines any form of conceptual thinking, and brings this issue to light. Everything can fall under input and output, but what really allows a work to speak for itself, complex or not, is the critical thinking backing it.

Isabella- Looking Outwards- 02

Harp Cave
by Steven Stavropoulos


The Harp Cave is an interactive installation which consists of a sheet-covered enclosure lined with harp strings that are attached to piezoelectric vibration sensors. These sensors trigger an Arduino, which activates sounds from Max Studio, which then activates visuals in Processing.
I highly admire this piece, due to its immersive nature, as well as it being quite multifaceted. It has an element of sound and visual, along with spacial since it is something that encapsulates the viewer/participant. These pieces of art always seem to grab my attention more so than others, since the nature of the interaction is not as ephemeral as simply viewing an object, or walking through a space. Being involved in a piece and immersing yourself within it leaves a more concentrated after-effect.

Generative Canvas
by Robin Jeanney


The Generative Canvas is an interactive painting experience, where the participant utilizes their personality and movement to paint lines and circles on a projected surface. The painting creates shapes of a certain size depending on how much the participant moves around and shouts. While I enjoy the premise of this piece, I was disappointed while watching the documentation. The “painting” was not very fluid and painting-like, and the shapes would just pop up into space. Relying on the fluctuating nature of the human element, this piece should reciprocate natural tendencies, but comes off as a little stiff.

Justification
by Ann-Katrin Krenz


This is an two-part installation, consisting of a scale which displays the emotional state of a twitter trend, in terms of the most basic of emotions; happy and sad. The second is a machine which manipulates the scale’s system. The ‘parasite’ has a desire to balance the emotions of the scale, and taps into twitter and sends himself emotional tweets in order to reach some equilibrium.
This interaction of machine and social network for the pure satisfaction of the machine surprised me. The machine has been given emotions, and the means of which it can deal with these emotions. Much like humans, the machine is constantly seeking to resolve unevenness, and since given the means to do so, it tries to find peace while the host wavers back and forth between states.

INSTRUCTIONALS» PseudoCODE Drawing

My initial attempt at the instructional drawing was a flop, partly because the outcome drawing wouldn’t necessarily be able to represent what the instructional was instructing was doing and partly because the commands just aren’t easy for a human to execute without being frustrated (myself included) and partly, just being obsessive. Luckily, the ‘failure’ served as a funny sort of re-whipping-into-shape.

During the first attempt, I found myself getting more into the ruler than the pencil. So in my second attempt, I tried to express that idea much more simply, along with implementing a couple simple loops/conditionals that punish the person executing the instructions for giving negative feedback about their user experience [as a computer].

So while my second attempt was under-parameterized, but perhaps more accessible/’interesting,’ my first attempt ended up failing in a very different way, in that it was too time consuming for the human “computers,” highly parameterized, and pretty devoid of interest. But aside from that, writing pseudocode for human computers was just really fun to do.

So I thought I’d share both attempts, if only to show what not to do (at least if you don’t have a reason to).


img002 img001 img004 img003

Second Attempt at Instructional Drawing (the one I actually got people to execute):

m0:
All instructions contained within functions labeled m(z) pertain to all subsequent functions labeled d(x) and n(y).
m2:
For all functions labeled d(x), use only your dominant hand.
m3:
For all functions labeled n(y), use only your non-dominant hand.
m4:
Simply execute each of the following functions in the numerical order listed below, satisfy its conditions, and then then move on to the next function, unless it is otherwise specified by a preceding function or unless x=y, then perform functions d(x) and n(y) simultaneously.
n0:
Hold your pencil in your dominant hand and ruler in your non-dominant hand. Place the paper directly in front of you on the table in portrait orientation.
d1:
Sit in a rolling chair facing a desk with the chair’s height adjusted to be just low enough to fit your knees underneath the desk but no lower.
n2:
Place the ruler on the paper such that its centimeter edge touches both the upper right hand corner and lower left hand corner of the paper.
d3:
Touch the index finger of your hand to the centimeter edge of the ruler at its 2 inch mark. Raise your finger a centimeter above the ruler’s surface.
d4:
Imagine a straight line orthogonal to the cm edge of the ruler (so, parallel to the unit notches) crossing over the 2 inch mark on the ruler.
n5:
Actually trace this imaginary line with your ‘finger’ — move it forward in space right over the ruler’s surface, and then rest it on the ruler’s surface at the midpoint of the imaginary line from function d4.
d5:
Hey! Your ‘finger’ should still line up with the 2 inch mark on the ‘ruler.’ If counting variable [n5b-count] is even, proceed to function n5b, else skip forward to function n6.
n5b:
Turn the paper and ruler 90′ clockwise. Repeat function n5, but replace the word ‘finger’ with ‘pencil’ or vice versa if it was already ‘pencil’. Add 1 to counting variable [n5b-count].
n6:
Apply just enough, but not too much pressure downwards at the 2 inch mark on the ruler to allow you to swivel the other end of the ruler around with your hand.
d7:
Don’t move at all, but imagine swiveling the ruler with one hand while holding it down with the other without disturbing the paper underneath at all.
n8:
Swivel the ruler lightly in a clockwise direction. Proceed to the next function, but don’t stop swiveling.
d9:
Hold the pencil upright with its tip at the midpoint of the long centimeter edge of the ruler. Let the pencil be pushed and guided by the swiveling ruler, generating lines and arcs on the paper.
n9:
Begin to bounce in your chair, while still using your pencil and ruler on the paper to make marks. Increase bounce frequency by a factor of 2 every 10 seconds. If [line-segs] > 1, stop bouncing after (20 + [line-segs]) seconds, else stop bouncing after 20 seconds and skip to m5.
m5:
Count the number of intersections made by the lines you have drawn on the page. Update the value of [line-segs] to this number.
m6:
Please rate the quality of this user experience with a value from 1-9 with 9 being the highest posible rating.
Store this number in the variable [value]
set the variable [satisfation] = [value]
set the value of [satisfaction = x
set the counter variable [overyet?] = [overyet? + 1]
if [overyet?] > 5 AND [satisfaction] >= 10
stop and quit
else
start again at the function d(x).
return pencil, return ruler


First Attempt at Instructional Drawing (plus some of the other statements I wrote trying to do this at first..)

#The subject codes like “subject1”, next to the subtask names, were just one idea that then got scrapped#
subtask0: subject1,
before you begin to do this task, sit in a rolling chair facing a desk with the chair’s height adjusted to be just low enough to fit your knees underneath the desk but no lower. Subject2, place one 8.5″ by 11″ piece of white printer paper directly in front of Subject 1 on the desk with the bottom edge of paper flush with the edge of the desk facing Subject1 and also with the midpoint of the line formed by the paper’s bottom edge aligned exactly at the midpoint of Subject1’s torso. Place a ruler and pencil on the table three inches to the right of the paper.
subtask1a: subject1,
pick up the pencil with your dominant hand or either hand if you’re ambidextrous. On the bottom edge of the piece of paper, use the provided ruler to measure out the midpoint of the line formed by the bottom-left corner and bottom right corner of the paper, and very faintly mark this midpoint with an approx. 2 mm. long vertical tick mark. Next, align the ruler so as to make a straight line bisecting the sheet of paper in half vertically through the midpoint you just measured. Using the ruler as a guide, very faintly draw a straight vertical line rising from the bottom of the page to the top. Put the ruler back where it was originally — to the right side of your desk.
subtask1b: subject1,
Grasp your pencil again. Prepare to sign your signature according to the following instructions. Make sure to center your signature at the midpoint of the bottom edge of the paper, such that the faint vertical line you drew also bisects your signature neatly. Use the bottom edge of the paper as a line for you to form your script/letters upon, like you were writing on college-ruled lined paper. After signing, remove your pencil from the paper. Get the ruler again. Measure the height of your signature and divide by two in order to find the midpoint between its highest and lowest points. Make small, faint, horizontal tick marks at both points as guides for the measurement. Then line up the the notched edge of the ruler directly on this horizontal line that bisects your signature, othogonal to the first line. Use your ruler to make the following marks with your pencil: a first endpoint dot 2mm to the left of the signature and another 2mm to the right of the signature, both falling on this bisection line. Using the ruler’s edge to connect these two endpoints, draw a straight line from one to the other, bisecting your signature horizontally.
subtask2a, subject1,
##if executed carefully correctly, subtask2 and subtask3 and subtask4 will analyze and visualize a subset of points that forms part (all the intersections) of the curving line of your signature by evaluating the spatial properties of these points using logical criteria.##
In order to pick an initial point on the curve for evaluation, first compare the height of the highest points on the curve on either half of your bisected signature. In whichever half has the highest point overall, find the lowest and rightmost point of intersection on that half of the curve that is still above the horizontal axis bisecting the signature from subtask1. If the lowest and rightmost point of intersection has not already been filled in, this will be the point you will evaluate as you now proceed to subtask2b.
subtask2a-mini-1, subject1,
[lohi-count] is a counting variable for the number of times that any newly visualized point that you have filled in / marked falls inbetween any two others, but only along the x-axis. To determine the first component of the output of subtask2b — the relational x-axis coordinates defined by the variable [lohi-choice] — which can be either valued as [highest] or [lowest], return [lohi-choice] = [lowest] if [lohi-count] is even, and return [lohi-choice] = [highest] if [lohi-count] is odd.
subtask2a-mini-2, subject1,
[lr-count] is a counting variable for the number of times that any newly visualized point that you have filled in / marked falls inbetween any two others, but only on the y-axis. To determine the second component of the output of subtask2b — the relational y-axis coordinates defined by the variable [lr-choice] — which can be either valued as [leftmost] or [rightmost], return [lr-choice] = [rightmost] if [lr-count] is even, and return [lr-choice] = [leftmost] if [lr-count] is odd.
subtask2b, subject1,
If the lowest and rightmost point has already been filled in, to determine the next point to evaluate, call subtask2a-mini-1 which outputs into [lohi-choice], and then call subtask2a-mini-2 which outputs into [lr-choice], whose respective values replace the contents of the array [lohi-choice, lr-choice]. Proceed to subtask2c. Else, proceed to subtask4. ##The array [lohi-choice, lr-choice] encodes four possible relational spatial codes: [highest, rightmost], [highest, leftmost], [lowest, leftmost], and [lowest, rightmost].
##Subject1 should interpret the values in [lohi-choice, lr-choice] as a command to find the lowest OR highest AND leftmost OR rightmost point of intersection on their signature curve, which will be further evaluated in subtask3 and subtask4 and potentially filled in during subtask4.##
Proceed to subtask2c.
subtask2c, subject1
If you have already filled in the point defined by the current values of [lohi-choice, lr-choice] generated by subtask2b, then choose the nearest point of intersection to your assigned one, but in the opposite direction of the vector defined by [lohi-choice, lr-choice], else call subtask4 [#notsure#]. If the point defined by the previous (one iteration before the current) values of [lohi-choice, lr-choice] generated by subtask2b is a point of intersection between the curve of the signature and either one or both of the two perpendicular lines that bisect it, then temporarily switch (until your current point coordinates fall on these axes again, then switch back) to choosing the furthest point of intersection from your assigned one rather than the nearest one, and in the same direction as the vector described by [lohi-choice, lr-choice]: this output will be interpreted as the new point that you will re-evaluate in subtask3. Proceed to subtask3.
subtask3, subject1,
Visually find the point of interest indexed by the relational coordinate values from subtask2. In evaluating this point using the following set of logical conditions, make sure to FIRST identify the correct truth values — [True] or [False] — and SECOND decide on the corresponding action based on the combination of *ALL* the relevant logical conditions: (1) that you have already filled in this point on the curve; (2) that this point is either the highest or lowest point on the curve whose location is the furthest to either the left or right. If both conditions (1) and (2) are satisfied, stop and procede to the next subtask. If the point on the curve being evaluated does not meet condition (1), but meets condition (2), then run subtask4. Or if the point being evaluated meets condition (1), but not (2), then run subtask2b. Else, run subtask2b.
##A single iteration of this subtask outputs one point’s spatial position on the curve and generates a physical index of it. However, you will test a number of points to see in what order they optimally fulfil a simple set of logical conditions. As you iterate this subtask more, it visualizes in higher resolution the differences in *how well* specific points along the curve meet the set of logical conditions above, and discretizes the ‘raw’ data of the hand-drawn curve.##
subtask4: Mark this point on the curve as accurately as possible with a single dot with the tip of your pencil. If you have evaluated every point on the line above the azimuth/horizontal axis of the signature’s curve or if there is not enough room physically on the line to draw any more points, then stop and procede to the next subtask. If not, run subtask2b.


subtask2: subject1, you will visualize a subset of points that forms part of the curving line of your signature by evaluating the spatial properties of these points using logical criteria. *ALL* of the logical conditions that make up the following set must be met fully in order to complete the subtask properly: (1) that you have not already marked this point on the curve with a dot; (2) that this point is the highest point on the curve whose location is the furthest to the left. If condition (1) and (2) are both met, mark this point as accurately as possible with a single dot with the tip of your pencil. Stop and procede to the next subtask. If the point on the curve being evaluated does not meet condition (1), but meets condition (2); or if the point being evaluated meets condition (1), but not (2), then repeat subtask2 until a point is found that meets both conditions (1) and (2). If you have evaluated every point on the line above the azimuth/horizontal axis of the signature’s curve or if there is not enough room physically on the line to draw any more points, then stop and procede to the next subtask.A single iteration of this subtask outputs one point’s spatial position on the curve and generates a physical index of it. However, you will test a number of points to see in what order they optimally fulfil a simple set of logical conditions. As you iterate this subtask more, it better visualizes the differences in *how well* specific points along the curve meet the set of logical conditions above, and discretizes the ‘raw’ data of the hand-drawn curve.
subtask3: mark this point as accurately as possible with a single dot with the tip of your pencil.
subject1, pick up ruler with your other hand. With your other hand, position the notched edge of the ruler so that this dot directly touches the 2 inch mark on the ruler’s notched edge. Return your pencil to where it originally was on the desk — to the right of the paper.
subtask5:
Touch the index finger of your non-dominant hand to the notched edge of the ruler at its 2 inch mark. Raise your finger a centimeter above the ruler’s surface. Imagine a straight line transversing the surface of the ruler (parallel to the unit notches), which connects one of its long edges to the other. Actually trace this imaginary line with your finger, moving it forward in space right above the ruler’s surface, and then stopping at the line’s midpoint. Your finger should still line up with the 2 inch mark. Apply just enough, but not too much pressure downwards to allow you to swivel the opposite end of the ruler with your other hand. Try swiveling the ruler with one hand while holding it down with the other without disturbing the paper underneath at all. Now find the the highest rightmost point on the curve created in subtask1 and swivel the ruler so that the notched edge just touches this point, forming an imaginary line segment between the highest leftmost and rightmost points on the curve. Lift both hands of the ruler without disturbing the paper or ruler’s positions. Grasp the pencil in your dominant hand again. Press down on the ruler with your non-dominant hand without shifting its position and without letting your fingers overlap the notched edge of the ruler. Mark a single dot at the highest leftmost point on the curve. Place your pencil tip exactly on the first dot generated in this subtask, and apply pressure sideways against the edge of the ruler in order to steady the pencil tip. Draw a straight ruler-guided line from this first, left dot to the other dot made in subtask2. Stop. Remove pencil from the paper.
Subtask6: subject1, visually identify the longest line segment remaining on the paper that was generated exclusively during subtask2. If you visually identify that there is only one line segment on the paper that was the longest generated during subtask2, then mark a single dot with the tip of your pencil at the midpoint of this line segment. ##Use your brain to encode the information that your making a mark at the midpoint of a line segment is called ‘line bisection’ and that ‘line bisections’ generate two new ‘line segments’ of equal lengths.## Stop and proceed to the next subtask. Mark a single dot with the tip of your pencil at the midpoint of this line segment in order to bisect it into two new line segments of equal lengths. If you visually identify multiple line segments of equal length on the paper that were the longest generated during subtask2, then mark a single dot with the tip of your pencil at the midpoint of only the leftmost one of these line segment, bisecting it. Stop and proceed to the next subtask.
Subtask7: subject1, #use your brain to encode the information that there is a variable called ‘num-lb’ that you will use to represent the cumulative number of ‘line bisections’ that you have executed exclusively during subtask2, subtask3, and subtask4. Use your brain to encode the information that there is another variable called ‘num-ls’ that you will use to represent the cumulative number of ‘line segments’ on the paper that you have generated exclusively during subtask2, subtask3, and subtask4. To calculate the current value of ‘num-lb’, you must first calculate the current value of ‘num-ls’, and then subtract 1 from this value.# Calculate the current value of ‘num-lb’. If ‘num-lb’ is equal to or more than , repeat subtask3 ‘num-lb’ times, else stop and proceed to the next subtask. ‘num-lb’
subtask3: subject1, place pencil to paper marking a single dot at the midpoint of the line created in subtask2, Repeat subtask3 the midpoint of the left segment and
then repeat subtask1 in the space directly above the first signature by vertically stack each finished iteration of the signature directly on top of the previous, taking care to make sure that the lowest regions of the line of the current iteration just touch the highest of the previous, neither hovering above not intersecting to create overlap. Continue to stack signatures until the very top edge of the paper is reached and then stop. If you must vertically compress the final iteration of the signature to fully fit within the page, do so. After the final iteration, stop. Repeat the whole
Subject 2: Simultaneously, starting from when Subject 1 lifts their pen from page after completing the fifth iteration, pull Subject 1’s rolling chair backwards orthogonally to the the desk in front — at a rate of 1 step backwards (foot1-behind-foot2-repeat) per blink of Subject 2’s eyes.
[lohi-choice] = [highest], then
[lr-choice] = [rightmost]
(with each call of subtask2b, count the # of times [lohi-count] that any new visualized point falls inbetween any two others only on the horizontal axis and [lohi] is even, choose lowest and if it is odd, choose highest) AND leftmost OR rightmost (with each call of subtask2b, count the # of times [lr-count] that any new visualized point falls inbetween any two others only on the horizontal axis and [lr-count] is even, choose rightmost and if it is odd, choose leftmost) point of intersection and this will be the point you evaluate. Proceed to subtask3.

IF….Then….Oblivion

So…….I tried on several occasions to create an IFTTT recipe that I liked but they have not been working! My recipes were 1)if a virgin posts on crags list, post a note to my Facebook 2)if i put a watch later video in my youtube account, a post will appear on Facebook 3)if anything about fashion comes up on buzz feed, a post will appear on my Facebook. but none have happened so far :( I think that this is a very interesting and useful program if one knows how to properly run it.

I am fascinated by the Drenestream project. I guess I am still left wondering why do APIs specifically have an all access pass to even classified information like that or was it that the artist had particular access to this data? and APIs seem to be becoming a resource like steel that is becoming an import part of the economy.  I enjoy how Jim Campbell’s piece takes these basic real world language elements and turns them into these data language elements.


Trapezoid for Alex

img017

This was probably the most confusing experience I have ever had.  I was not sure what they meant by the top side so I assumed that it was the top side of the square because it was impossible to find the midpoint of a non existent topside.  I had to circle and label the transition words such as “and” and “to” in order to determine exactly how, many lines were being drawn and to where they were connecting.  In all honesty, I probably failed this whole test but it was really nice setting a time out of my day to focus on one task.  I would say this is a type of code because it has a hyper specific set of instructions that arrive to a specific conclusion and if done properly, will always arrive to the same conclusion. In my experience sat the executor, it was left up to my interpretation of language that determined the end result. But then again, I am illiterate so I might have just idiotically messed this up.