nannon-Reading-01

2. The Critical Engineer raises awareness that with each technological advance our techno-political literacy is challenged.

This document struck me immediately as extremely idealistic, though also extremely desirable and hopeful. Though the tone acknowledges the power of computing, it also implies that the original authors know how far technology can take us.

What stood out to me is that about half the tenets could explicitly applied to many other fields, but particularly design. These tenets, including 2,3,6 and 8 especially, are very close to the philosophy over in the School of Design. It's an emphasis on how our built (designed) world is converging more and more with the engineered (digital) world. A huge majority of college graduates in this decade will work in some kind of technological field, and this manifesto applies to anyone who will influence a new product or object.

I believe that engineers who are on the front line literally writing the code that powers almost all our products today should hold these tents close at hand, but others who will be involved with building products should be self-aware of their actions + consequences as well.

The second tenet rings so true in 2018, especially in light of GDPR and the Facebook testimonies. The tech-literacy gap is going to be a shattering crisis soon (if not already), and it's very clear in how government is interacting with private tech companies.

chaine-Interruptions

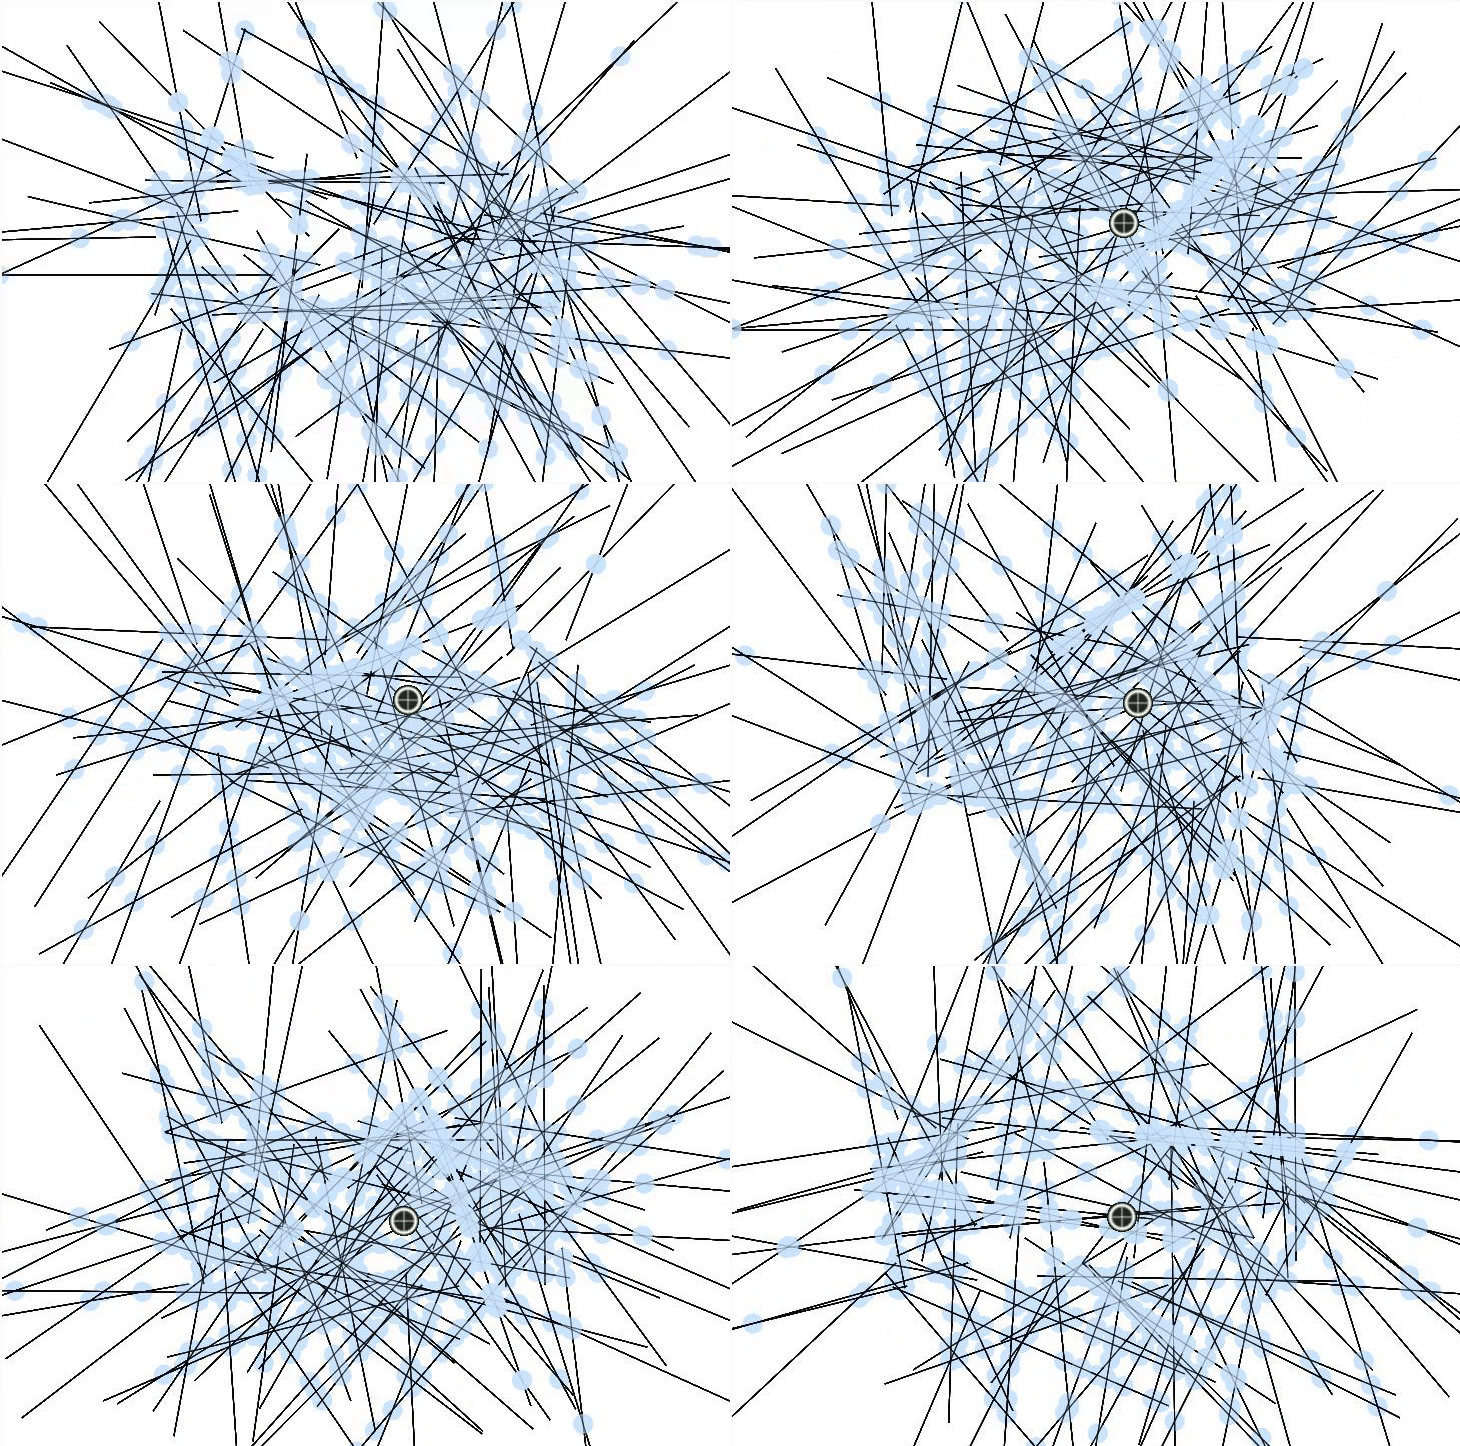
  1.  The lines' centers can be split into a grid system
  2.  All angles are randomized
  3.  White or light grayish background with black lines
  4. The overall shape of the canvas is a square but some lines may protrude a bit more
  5.  There are clutters of gaps that seem to happen in random locations
  6.  The gaps are usually clumped together and are missing more than one line per gap
  7.  Each gap seem to form into random shapes (not just a circle, square, etc.)
  8.  The gaps are of varying sizes
  9.  The length of each line is the same
  10.  There is a very small margin surrounding the lines

Image from Gyazo


var boolDoRefresh;
var size = 40;
var gridSpacing = 12; 
var lineLength = 20;
var angleList = [];
var startAngle = 0;
 
//Things to consider while creating "gaps":
//how many gaps?
//how large are the gaps?
//which row/col are the gaps located?
 
var gapList = [];
 
function setup(){
  createCanvas(720,720);
  boolDoRefresh = true;
  var slant = random(0,1);
  var isVertical = random(0,1);
  for (var i = 0; i < width + lineLength; i += gridSpacing){
    for (var j = 0; j < height + lineLength; j += gridSpacing){
    if (isVertical < 0.5){
      append(angleList, random(-1*PI, PI)); //angle of line horizontal
    }
    else{
      append(angleList, random(-1*PI, PI) + (PI)); //angle of line vertical
    }
  }
  }
  createGaps();
}
 
function createGaps(){
  var gridSlots = sq(round(((width + lineLength + 1)/gridSpacing)))
  var numGap = int(random(3,15));
  for (var k = 0; k < numGap; k += 1){
    gapList = append(gapList, int(random(1, gridSlots)));
    gapSize = int(random(10,80));
    for (var m = 1; m < gapSize; m += 1){
      chance = random(0,1);
      if (random(0,1) < 0.8){
        if (chance < 0.4){
          append(gapList, gapList[m-1] + 1);
        }
        else{
          append(gapList, gapList[m-1] - 1);
        }
      }
      else{
        if (chance < 0.6){
          append(gapList, gapList[m-1] + 59);
        }
        else{
          append(gapList, gapList[m-1] - 59);
        }
      }
      for (var n = 0; n < gapList.length; n += 1){
        angleList[gapList[n]] = 1000;
      }
    }
    gapList = [];
  }
}
 
function draw(){
  if (boolDoRefresh){
    for (var i = lineLength; i &lt; width - lineLength; i += gridSpacing){
      for (var j = lineLength; j &lt; height - lineLength; j += gridSpacing){
        strokeWeight(1);
        //ellipse(i,j, 5,5);
        var angle = angleList[startAngle];
        if (angle &lt; 999){
          //I gave each line their own little "squares" on a grid of W x H
          //Each grid consists of two lines, one line is a reflection of the other line
          //Both lines start at the center of their "squares"
          //Thus, the two lines together look like one line
          line(i, j , i+(lineLength/2)*cos(angle), j+(lineLength/2)*sin(angle));
          line(i, j , i+(lineLength/2)*cos(angle+PI), j+(lineLength/2)*sin(angle+PI));
        }
        startAngle += 1;
      }
    }
  }
  boolDoRefresh = false;
}
 
function mousePressed(){
  boolDoRefresh = true;
  angleList = [];
  startAngle = 0;
  gapList = [];
  setup();
}

I started this project by realizing that there was some sort of grid system with a randomized, angled line in each grid unit. I first decided to code the overall grid without any gaps, but realized that too many of the lines started to look like they were forming messy clusters. (e.g. one grid unit had a line pointing to the right and the very next grid unit to the right was pointing left and it just looked like two lines on top of each other) Therefore, I decided to give each line their own square "space" by drawing two lines to look like one. I first drew half of a line starting from the center of a grid unit and reflected it to draw the other half. That worked out much better. Meanwhile, for randomizing the gaps, I sketched out what I needed to know: how many gaps, how large each gap is, where the gap is. I learned that what I thought was random was clearly showing that it didn't feel as random in real life. There were sometimes columns of missing lines and I struggled to find the right proportion of hiding the aforementioned patterns. I learned through this that coding was a test of trial and error and logic. What may seem logically sound on paper may not look it in the actual product. The fact that Vera Molnár created this piece fascinated and inspired me, especially given the time period in which she created this.


shuann-Interruptions

  1. The artwork is square.
  2. The artwork consists of many short black lines, on a white background.
  3. The lines all have the same length.
  4. Overall there seems to be a general direction, horizontal or vertical, that all the lines follow (noise exists obviously)
  5. However each line by itself seems to have a somewhat random direction that it points to
  6. every line overlaps with the previous line at the half-point mark
  7. There are empty holes in the piece, where there are no lines
  8. The empty spots where lines are skipped are clustered together
  9. The exact positions of the holes seem random
  10. The size of the holes are also random

GIF:

Process:

I personally think the result is pretty satisfactory especially given the fact that I was able to really get a good understanding of what noise is and how to use it through the completion of this project. I started by creating an invisible grid system where each of the grid contains a simple straight line. Then I randomly rotate each lines separately using translate and push and pop. Lastly, to create the holes I had to understand noise which I found very challenging at first. Partly because the documentation on the p5.js site were not super great at explaining the concept in plain, understandable language. However, after learning it I realized how adaptive noise can be, and I can already see how it can be used in many other cases.

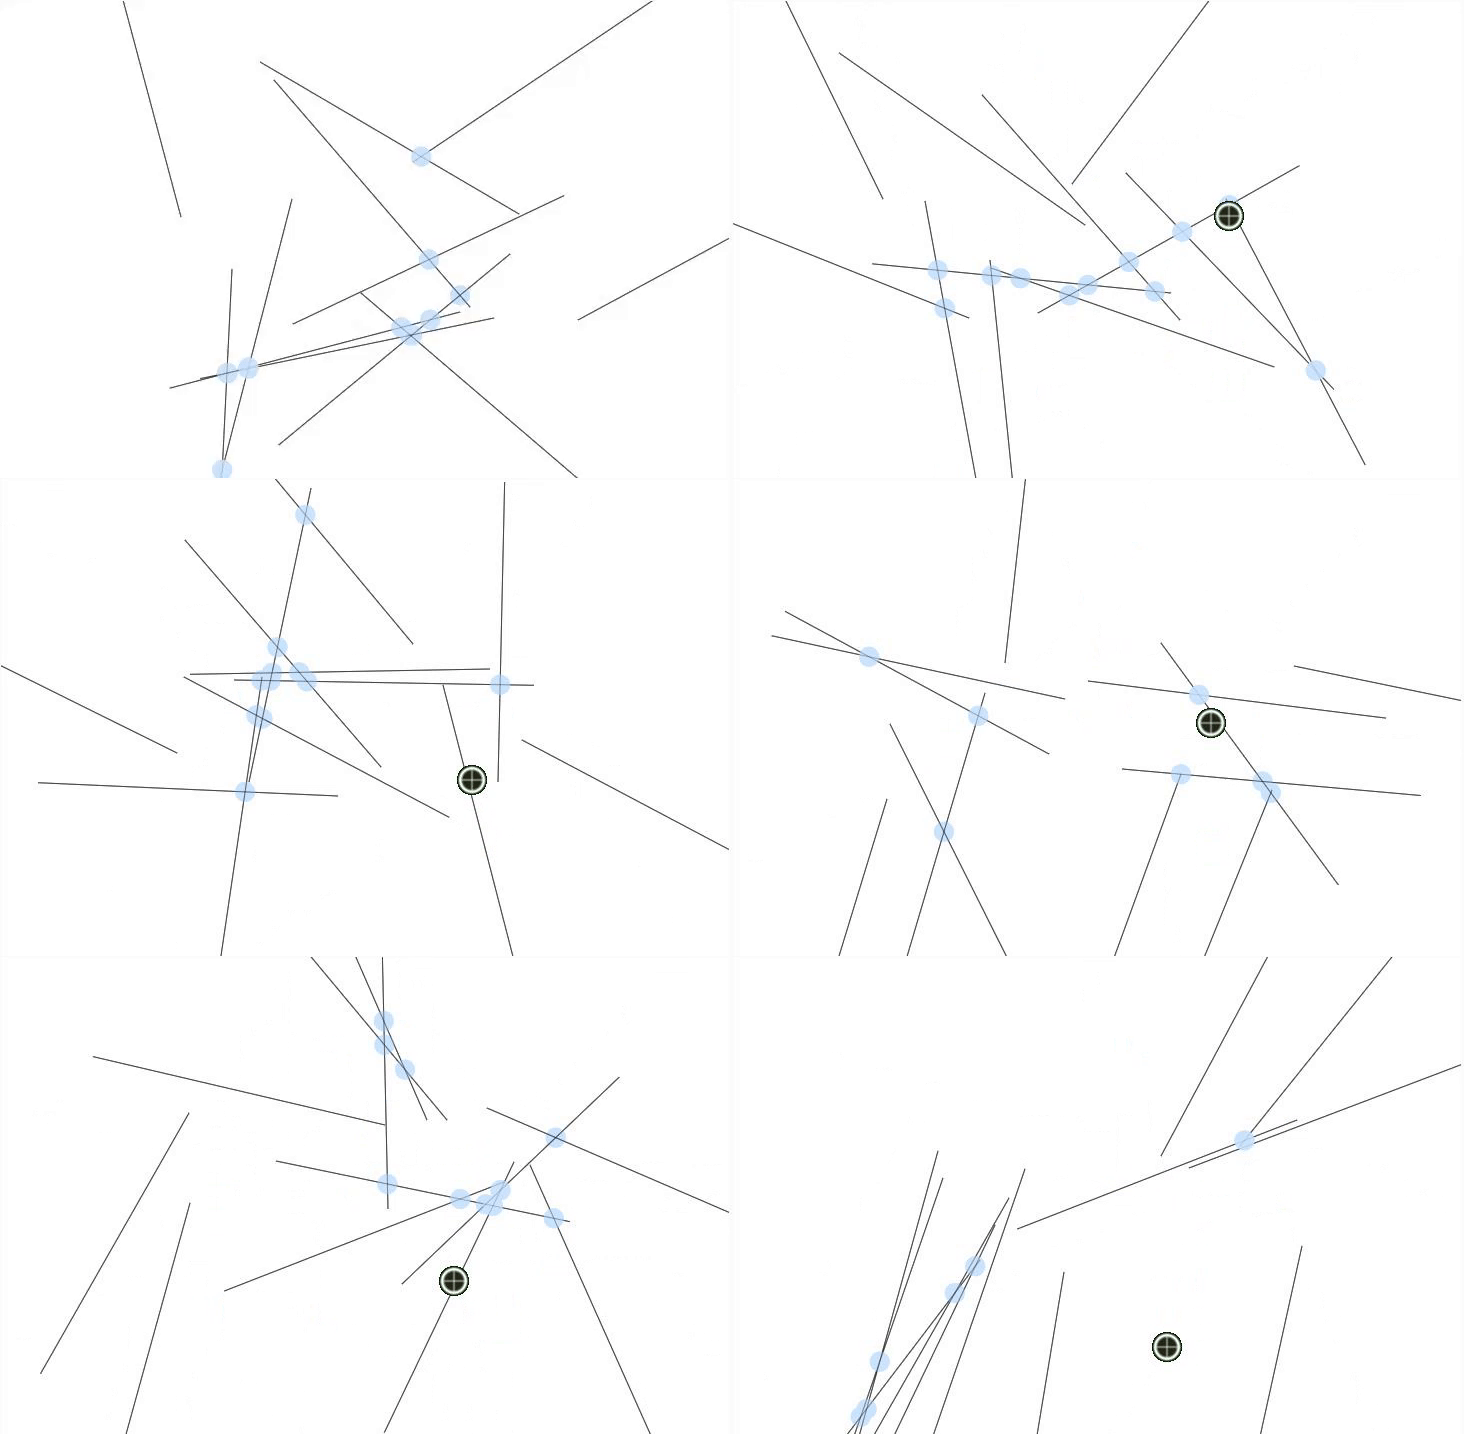
chaine-Intersections

Image from Gyazo
Image from Gyazo

  var boolDoRefresh;
  var size = 40;
  var lineLength = 300;
  var numLines = 12;
  var lineList = [];
  var x = [];
  //var circleCoords = [];
  //var circleList = [];
  //var foo = 0;
 
  function setup(){
    createCanvas(728, 480);
    background(255,255,255);
    boolDoRefresh = true;
    for (var i = 0; i &lt; numLines; i ++){
      append(x, int(random(150, width - 150))); //starting x
      append(x, int(random(150, height - 150))); //starting y
      append(x, int(random(0, 361))); //angle of line
      append(lineList, x);
      x = [];
    }
  }
 
  function draw(){
    if (boolDoRefresh == true){
      for (var j = 0; j &lt; lineList.length; j++){ //drawing where the circles should be
        var a1 = lineList[j][0];
        var b1 = lineList[j][1];
        var angle2 = lineList[j][2];
        var a2 = a1+lineLength*cos(angle2);
        var b2 = b1+lineLength*sin(angle2);
        for (var k = 0; k &lt;lineList.length; k++){ 
          var a3 = lineList[k][0];
          var b3 = lineList[k][1]; 
          var angle3 = lineList[k][2]; 
          var a4 = a3+lineLength*cos(angle3); 
          var b4 = b3+lineLength*sin(angle3); 
          //This long formula was taken from http://www-cs.ccny.cuny.edu/~wolberg/capstone/intersection/Intersection%20point%20of%20two%20lines.html 
          //Paul Bourke's paper 
          if (((b4-b3)*(a2-a1)-(a4-a3)*(b2-b1))!=0){ 
            var ta = ((a4-a3)*(b1-b3)-(b4-b3)*(a1-a3))/((b4-b3)*(a2-a1)-(a4-a3)*(b2-b1)); 
            var tb = ((a2-a1)*(b1-b3)-(b2-b1)*(a1-a3))/((b4-b3)*(a2-a1)-(a4-a3)*(b2-b1)); } 
          else { 
            ta = -1; tb = -1;
          } 
          if (ta &gt;= 0 &amp;&amp; ta &lt;= 1 &amp;&amp; tb &gt;= 0 &amp;&amp; tb &lt;= 1){
            fill(204,229, 255);
            strokeWeight(0);
            ellipse((a1+ta*(a2-a1)),(b1+ta*(b2-b1)), 20);
          }
          else{
            continue;
          }
        }
 
	fill(255,255,255);
	strokeWeight(0.1);
	for (var i = 0; i &lt; numLines; i++){
          var x1 = lineList[i][0];
          var y1 = lineList[i][1];
          var angle = lineList[i][2];
          //below formula from https://stackoverflow.com/questions/48525583/get-a-points-position-from-an-angle-and-the-length-of-the-line
          line(x1, y1, x1+lineLength*cos(angle), y1+lineLength*sin(angle));
          //append(lineList[i], x1+lineLength*cos(angle));
          //append(lineList[i], y1+lineLength*sin(angle));
	}
        //print(a2,b2);
        //print(lineList);
        //print(ta, tb);
      }
    }
    boolDoRefresh = false;
  }
 
  function mousePressed(){
    boolDoRefresh = true;
    x = [];
    lineList = [];
    setup();
  }

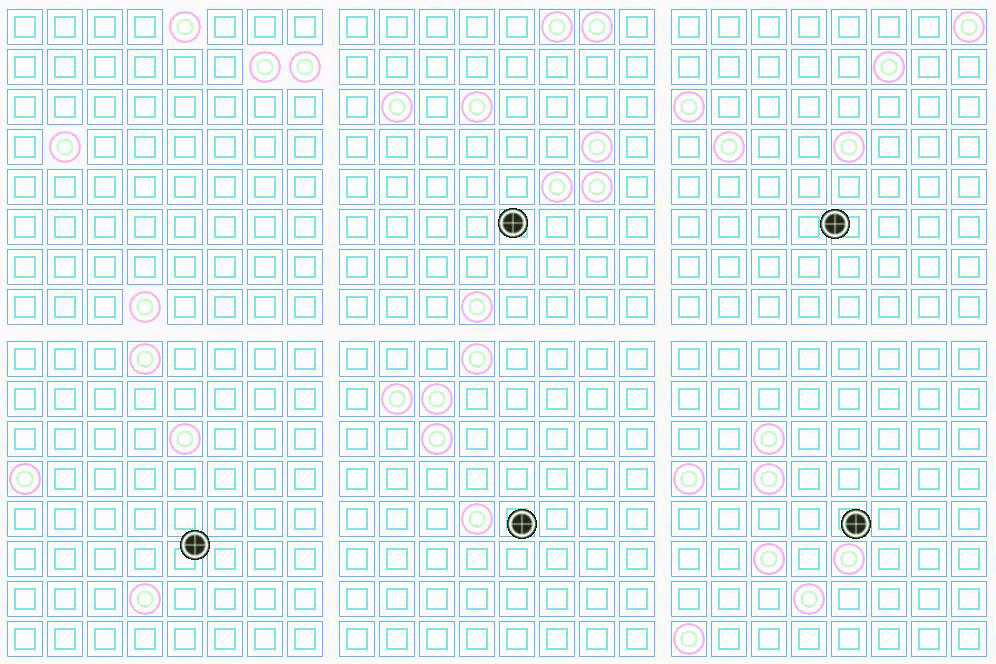
chaine-IterationExercise

Image from Gyazo

var boolDoRefresh;
var size = 40;
 
function setup(){
  createCanvas(400,400);
  boolDoRefresh = true;
}
 
function draw(){
  if (boolDoRefresh){
    for (var i = 40; i < height-40; i+=40){
      for (var j = 40; j < width-40; j+=40){
        if (random(1) < 0.1){
	  stroke('#fae');
	  strokeWeight(2);
          ellipse(i+18,j+18,30,30);
	  stroke('rgba(0,255,0,0.25)');
	  ellipse(i+18,j+18,15,15);
        }
        else{
	  stroke(color(102, 178, 255));
	  strokeWeight(1);
          rect(i,j,35,35);
	  stroke(color(0, 204, 204));
	  rect(i+7.5,j+7.5,20,20);
        }
      }
    }
  }
  boolDoRefresh = false;
}
 
function mousePressed(){
  boolDoRefresh = true;
}

shuann-Reading01

"3. The Critical Engineer deconstructs and incites suspicion of rich user experiences."

I think what this tenet is talking about them importance of not simply accepting what is offered out there in the world. Instead, we need to always keep a critical eye on the new technologies and as well as the new experiences that they claim to bring. We need to understand why they are developed and how they are adapted before we take any actions. In addition, it is in fact almost always the case that a rich user experience mutually benefits not only the users themselves but also the company who provides the service/product. With the spreading of information technology today, information is traveling at a rate that is no longer limited by space and time. Thus this also enhances the effectiveness of "word of mouth". By providing good experience with existing users, this means they business has a better chance of reaching a larger group of potential users though the self-identified promotors.

Spoon-Interruptions


1
2
3
4
5
6
7
8
9
10
11
12
13
14
15
16
17
18
19
20
21
22
23
24
25
26
27
28
29
30
31
32
33
34
35
36
37
38
39
40
41
42
43
44
45
46
47
48
49
50
51
52
53
54
55
56
57
58
59
60
  var boolDoRefresh;
  const CANV_HEIGHT = 720;
  const CANV_WIDTH = 720;
  const H_MARGIN = CANV_WIDTH / 14;
  const V_MARGIN = CANV_HEIGHT / 14;
  const V_NUM_LINES = 56;
  const H_NUM_LINES = 56;
  const H_UNIT_SIZE = (CANV_WIDTH - (H_MARGIN * 2)) / H_NUM_LINES;
  const V_UNIT_SIZE = (CANV_HEIGHT - (V_MARGIN * 2)) / V_NUM_LINES;
  const LINE_LENGTH = H_UNIT_SIZE * 2;
  const HORIZONTAL_FREQ = 0.25;
 
  function setup() {
    createCanvas(720, 720);
    background('#EEEEEE');
    strokeWeight(0.75);
    boolDoRefresh = true;
  }
 
  function draw() {
    if(boolDoRefresh) {
      background('#EEEEEE');
      constructLines();
      boolDoRefresh = false;
    }
  }
 
  function mousePressed() {
    boolDoRefresh = true;
  }
 
  function constructLines() {
    var angleOff = random(0.2);
    var gapX = random(0.5);
    var gapY = random(0.5);
    var gapScale = 0.15;
    noiseSeed(random(100));
    var horizontal = random(1);
    for(var i = 0; i < H_NUM_LINES; i++) {
      for(var j = 0; j < V_NUM_LINES; j++) {
        angleOff += 0.1;
        gapX += i * gapScale;
        gapY += j * gapScale;
        if(noise((i * gapScale), (j * gapScale)) > 0.25) {
          var angle = random(noise(angleOff) * 90);
          centerLine(H_MARGIN + i * H_UNIT_SIZE, V_MARGIN + j * V_UNIT_SIZE, LINE_LENGTH, angle, horizontal);
        }
      }
    }
  }
 
  function centerLine(x, y, length, angle, horizontal) {
    angleMode(DEGREES);
    var randNum = random(2);
    var x1 = x + ((length / 2) * (horizontal < HORIZONTAL_FREQ ? cos(angle) : sin(angle)));
    var y1 = y + ((length / 2) * (horizontal < HORIZONTAL_FREQ ? sin(angle) : cos(angle)) * (randNum > 1 ? 1 : -1));
    var x2 = x - ((length / 2) * (horizontal < HORIZONTAL_FREQ ? cos(angle) : sin(angle)));
    var y2 = y + ((length / 2) * (horizontal < HORIZONTAL_FREQ ? sin(angle) : cos(angle)) * (randNum > 1 ? -1 : 1));
    line(x1, y1, x2, y2);
  }


Process/Reflection:

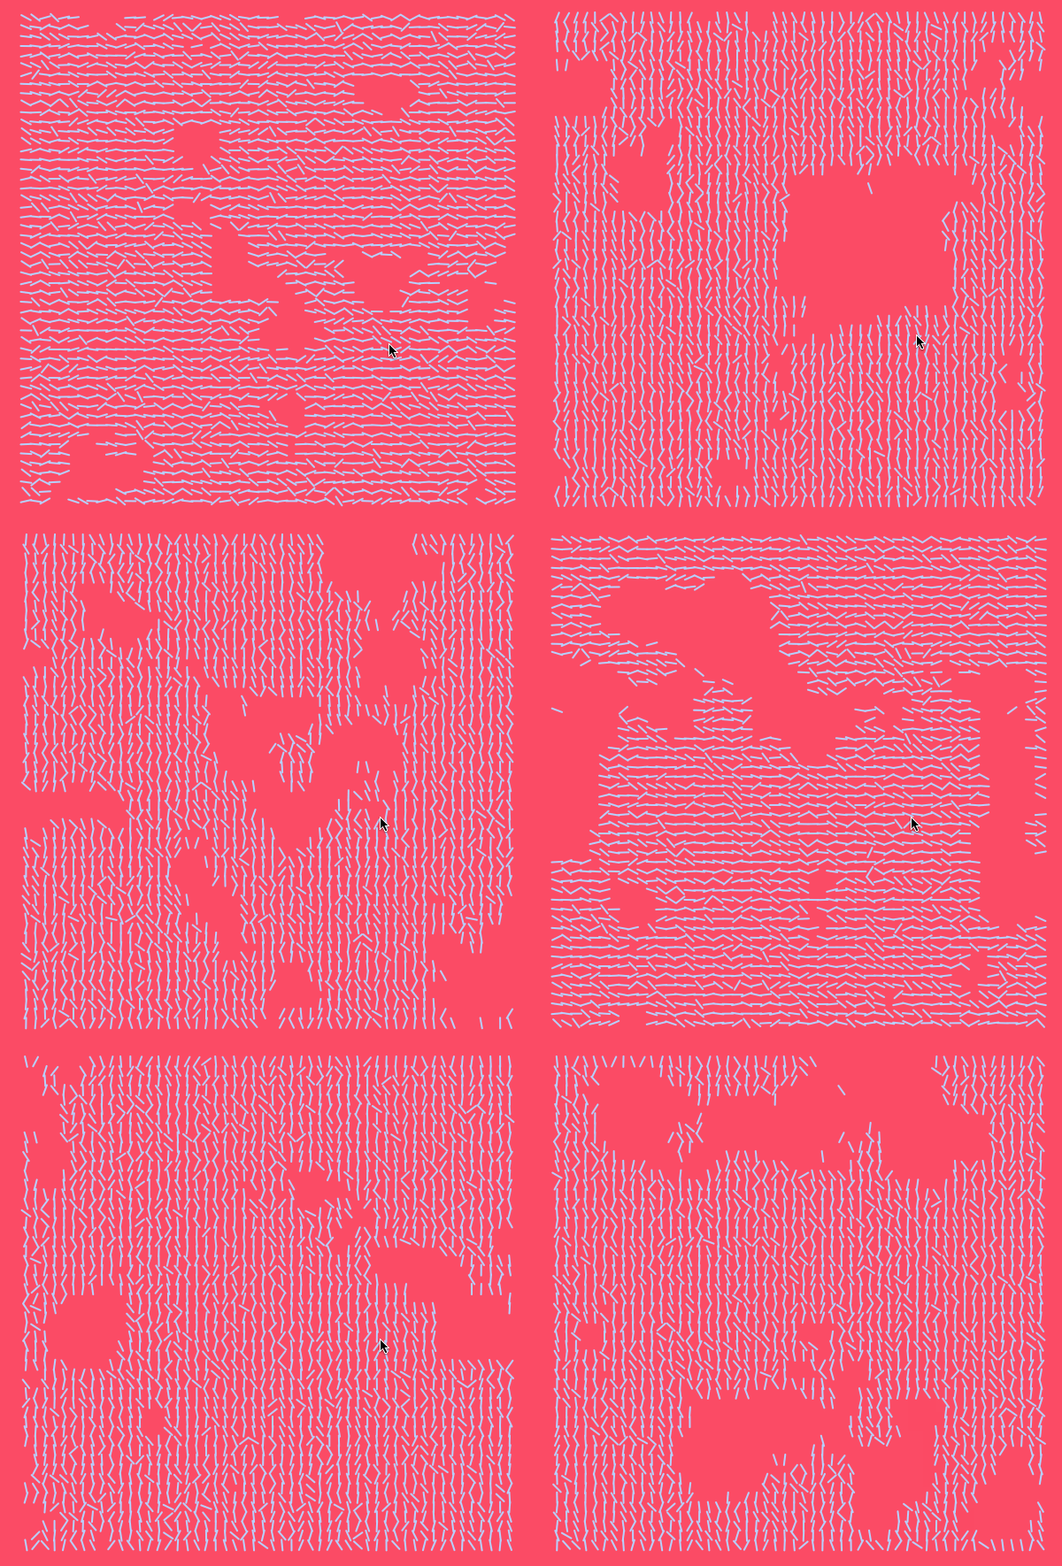
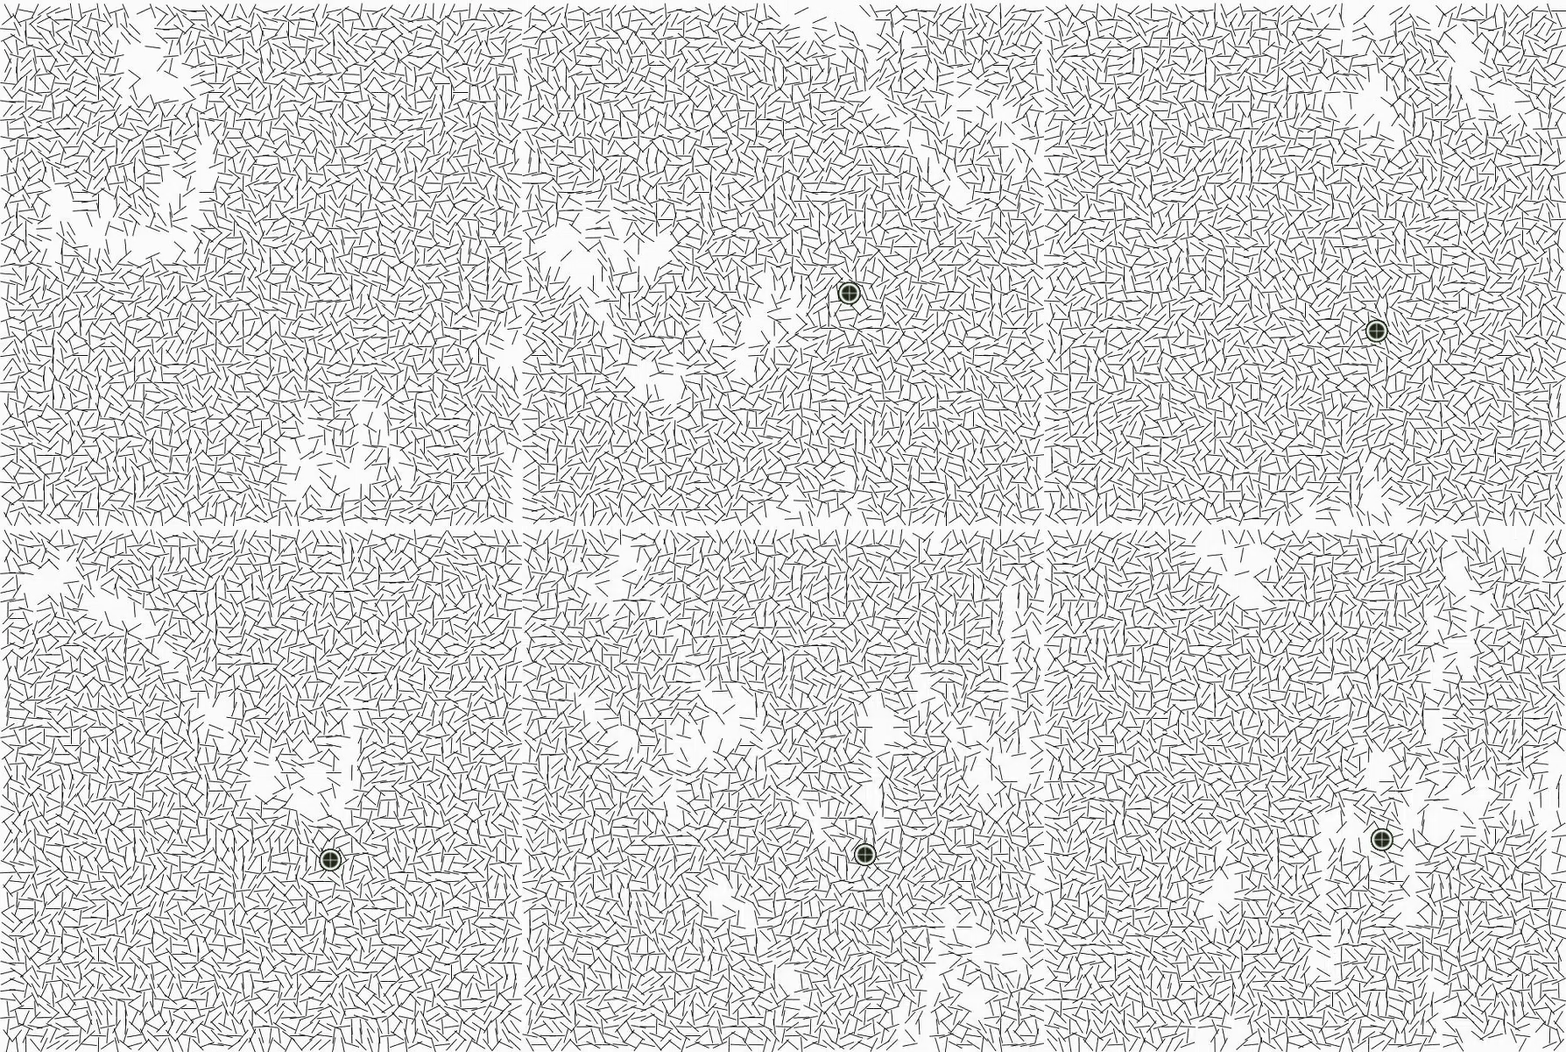
I dedicated a significant amount of my work on this project to my observations of Vera Molnár's Interruptions. I noted the following:

  • In each composition, all the lines are the same length.
  • Each line's center falls into a 56x56 grid.
  • Each line's length is twice the distance of the spacing on the grid (in other words, the endpoints of a fully vertical or horizontal line will intersect with the centerpoints of the lines immediately next to it)
  • While the lines' angles are random, they tend to point in a vertical direction on three of Molnár's compositions and in a horizontal direction on one composition
  • Not every line is present. There are gaps in each composition. While the location of the gaps seem random, missing lines tend to exist near other missing lines.
  • Gaps appear fairly infrequently
  • There is some slight variation in the background color, ranging from off-white to a mid-light grey.
  • There is a margin around each composition. Not all of the compositions are centered, but the most centered composition leaves a  margin of about 1/14th of the page around the composition.

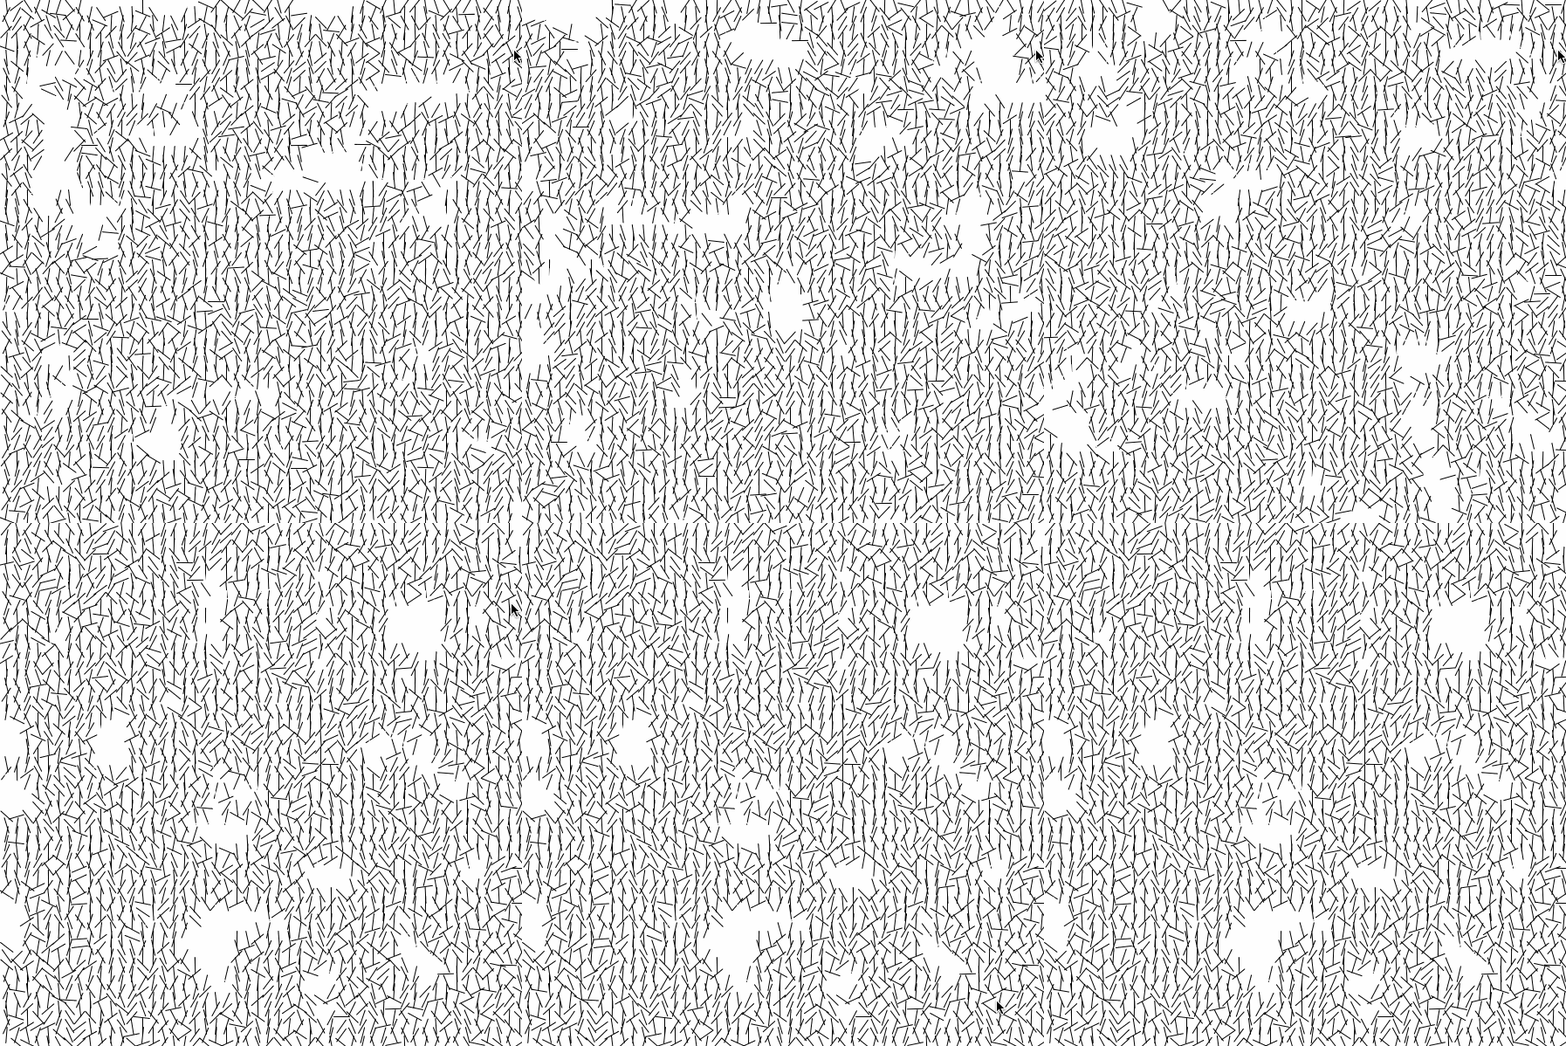
As I was creating my own compositions in Javascript, I noticed that there was a considerable amount of care needed to produce a convincing randomness. I Perlin noise to create the gaps and the variation in line angles, something that did not exist in the time when the original compositions were created, to make a composition that was close to Molnár's. I think I was only mildly successful, though, as while the lines seem to have a similar character to the originals, the gaps do not. Their borders are too harsh and they are not quite the right shape. I think my line weight is a little off, as well.

Reproducing randomness is incredibly challenging without knowledge of the calculations that led to Molnár's compositions, and I now have a much greater appreciation for the work that goes into producing art with randomness as a factor.
yuvian-Interruptions

Observations:
- The artwork is square.
- The artwork consists of many short black lines, on a white background.
- The lines all have the same length.
- The artwork is basically composed of a 60 * 60 grid.
- Horizontal lines show up less frequently than vertical lines.
- Lines take up more than half of the space.

The most challenging part of this assignment was understanding Perlin noise. I've used it in the past but not much. The concept of noise and trigonometric functions in order to randomize the angles of the lines took a while for me to figure out. Something that I understood almost at once was the gridlike structure of Molnár's "Interruptions". I immediately noticed the 56X56 grid upon which the lines were fixed. I think I was generally successful at recreating the artist's work but my lines are not as randomized as the original. This is probably an easy fix as I would have to go back in and manipulate some of the variables within noise but for now, it is a close representation of Molnár's work. I appreciate how seemingly simple the original work appears at first when in actuality, it is a lot more complex than I had originally thought.

paukparl-Interruptions

observations:
1. Two colors are used: black and white.
2. The artwork is square.
3. There's a bit of margin on all sides
4. All lines are equal length.
5. The lines are rotated at random angles.
6. The center point of the lines are precisely positioned on a grid.
7. There are a total of 57x57 spots
8. There are empty spots. Some are small with just one or two lines missing. Some have grown bigger.
9. There is either a horizontal or vertical grain.
10. The length of each line is the twice that of the spacing between center points of adjacent lines (or maybe a bit shorter).

sketch:


var NOISE_SCALE = 0.13;
var NOISE_SCALE_ROT = 1;
var NOISE_THRESHOLD = 0.3;
var UNIT_SPACE;
 
var grains = ['H', 'V'];
var defaultRotation;
var justClicked = true;
var initialSeed;
 
 
function setup() {
  createCanvas(720, 720);
  UNIT_SPACE = width/61;
  stroke(0);
  strokeWeight(1);
  initialSeed = random(1000);
  noiseDetail(8, 0.5);
}
 
 
function draw() {
  if (justClicked) {
 
    // set grain between "horizontal" and "vertical"
    if (random(grains) === 'H') defaultRotation = 0;
    else defaultRotation = PI/2;
 
    // set a new noise seed value
    noiseSeed(initialSeed++);
 
    // draw pattern
    background(255);
    for (var y = 3; y &lt; 59; y++ ) {
       for (var x = 3; x &lt; 59; x++) { // generate noise var noiseValue = noise(NOISE_SCALE*x, NOISE_SCALE*y); // low-pass filter if (noiseValue &gt; NOISE_THRESHOLD) { 
 
           // draw individual line
           push();
           translate( x*UNIT_SPACE, y*UNIT_SPACE );
           rotate(defaultRotation);
 
           // apply noise to rotation
           rotate(map(noise(NOISE_SCALE_ROT*x, NOISE_SCALE_ROT*y), 0, 1, -PI/1.8, PI/1.8)); // rotate based on noise
           line( -0.95*UNIT_SPACE, 0, 0.95*UNIT_SPACE, 0 );
           pop();
         }
       }
    }
 
    justClicked = false;
  }
}
 
 
function mouseClicked() {
  justClicked = true;
}

thoughts:
Writing down the observations really helped me realize certain details that might have gone unnoticed such as the horizontal or vertical grain. The images also grew on me as I looked more at them. I set off to learn more about the Perlin noise. Soon I figured that the pattern of the empty spots and line rotations could be achieved with Perlin noise. I started coding right away, only to find out that I didn't understand Perlin noise correctly. So I took my time reading the p5 documentations and some texts on the mathematical foundation of Perlin noise. I was really surprised when I found out that Vera Molnar made Interruptions before Perlin noise was invented. If there was any particular difficulty with this sketch, it was trying to get both outcomes right--the empty patterns and line rotation--with the same parameters for the noiseDetail() function.

casher-interruptions

  1. All the lines are the same length.
  2. The lines are small.
  3. The lines are black and the background is white.
  4. Their placings seem to have some kind of pattern.
  5. There are holes where there aren't any lines.
  6. Some of the lines create triangles or other shapes.
  7. Not all of the lines intersect with another line.
  8. There are around 50-60 lines per side.
  9. Most of the lines are vertical.
  10. Each line is rotated around its center.


I started out by writing some pseudocode on paper. I knew the general steps were to 1) create a grid of many small lines, all equal in length, and then 2) rotate each line with some kind of randomly calculated value (which I would soon learn is noise). Next I took to the p5.js editor and re-purposed some of the logic from my Intersections code: using two nested for loops, I began to create some lines. Using the i and j indices as x1 and y1 values, and assigning modified versions of those values to x2 and y2, the lines could stay the same length.

After that point, I got stuck. I understood that the rotations of the lines were not totally random, in that they depended on some kind of mathematical pattern, so I called Char over. She introduced noise fields, explained noise them in depth, and outlined all of the constants, variables, and parameters that I would need when using one in my code. After a lot of toying around with values, I came up with this version of Interruptions. It is not terribly similar to Molnar's versions, but I believe it is equally interesting. By trudging through this activity, I've learned that noise fields are super fascinating when visualized in this way, and that Molnar was an incredibly epic woman.