Eric Brockmeyer – Project 2 (finished work)
I have always found the stairs in Pittsburgh to be unexpectedly beautiful and exciting to discover. They are tucked between houses, up steep hills, and along busy streets all over the city. Pittsburgh public stairs are iconic of a city built on hills and should be maintained and respected as such. Unfortunately, they have fallen into a state of dilapidation and disrepair. It could be that fewer people take the stairs since their construction due to increase in ownership in cars, or it could be a National trend toward underfunded and under maintained infrastructure. In a report in 2009, the American Society for Civil Engineers ranked the US as a D (on an A-F scale).
The purpose of this project was to find a source of data that was easily accessible and convert it into some form of useful data. I used a website which contains a collection of photos of Pittsburgh public stairs and used these images to drive a Mechanical Turk survey regarding the state of disrepair of these stairs. The data analysis was somewhat subjective and based on inconsistent images of a sampling of stairs, however it does provide some general feedback on what the most prevalent problems are.
I used 45 images of 45 different sets of stairs. Each of these had 5 surveys performed to help discover anomalous answers and to provide a larger overall data set. The survey consisted of 8 questions 2 of which were controls to cull bad responses (a learned necessity when using a service such as Mechanical Turk. They are as follows:
1. Is the hand rail rusted?
Yes
No
2. Is the hand rail bent or broken?
Yes
No
3. Are plants growing on or over the path?
Yes
No
4. Is the concrete chipped or broken?
Yes
No
5. Is there a pink bunny in the image? (control)
Yes
No
6. Is there exposed rebar?
Yes
No
7. Is this an image of stairs? (control)
Yes
No
8. Would you feel safe using these stairs?
Yes
No
To analyze and visualize the data I made a couple of processing sketches which performed different functions. I created a sketch to download and save all the images used in the survey into a folder of thumbnails and full size images. Next, I wrote a sketch to extract the results from my Mechanical Turk survey. The results came as a .csv file and was easily traversed and accessed using the XlsReader library. Finally I created two different visualizations to get some idea on what this data meant.
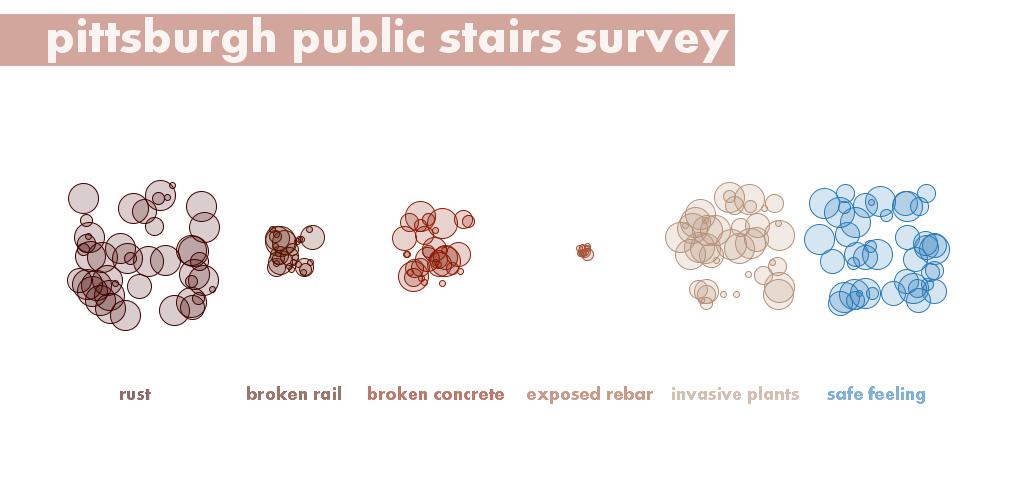
One visualization (at the top of this page) describes the overall responses to the questionnaire across all 45 images. Each circle represents the number of positive responses from each question for each question in each image. The spacing of the circles is randomly generated based on the total number of affirmative responses for each question.
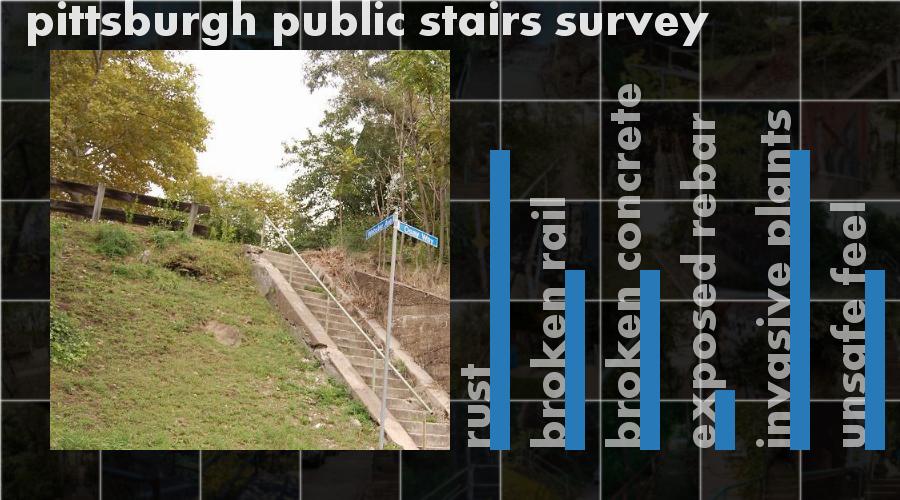
The other visualization (below) contains an array of all 45 images which a user can select and see the data related to each individual photo. It also provides a bar graph on top of each thumbnail which is the sum of all affirmative responses for that image. Thus the larger the bar the more decrepit those stairs should appear.
The results of this project were interesting but not too surprising. I was very interested in the subject matter but I think the work flow from web images to mechanical turk to processing was fun to navigate. This project has uncovered some of the challenges in this work flow and there is definitely room to improve the interaction between these pieces of software.
Otherwise, I think the data provides some feedback on the number of stairs which require maintenance or larger repairs. I’m considering another iteration on this concept which encourages individuals to participate in a game where they are actually surveying public works like the Pittsburgh public stairs.


hi Eric – interesting project! Here are the comments from the PiratePad:
polish hill has some weird stairs
awesome job using mechanical turk, glad you went for it.
problem you mentioned about detail of photos and seeing rust or etc
Interesting process. Is there a further application for this information. What do you conclude?
Interesting choice of subject.
This is a nice, interesting, clear, well-executed project.
It’s modest, but interesting.
I would think a big blue bar means the measurment is “better”, not worse. Use red?
In your blog post, I hope you can comment on the process of using MTurk.
An impressive set of stairs, 1919 and today: http://retrographer.org/photos/4181
I like the subject matter, public stairs are a really unique thing about Pittsburgh.
Very interesting topic. What are the axes of the clusters? Did you sort the thumbnails in any particular way?
I kinda would be interested to see how you can sort the stairs and pictures based on the attributes of each – rust %, etc. Might help show trend or reveal interesting thing about the data?