Eric Brockmeyer – Project 2 (data sources)
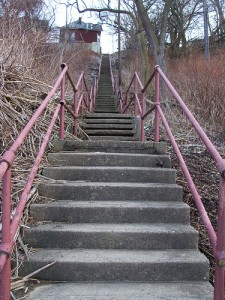
Pittsburgh Public Stair Cases
Visualization of steps based on game style interaction. Users may participate by downloading a smartphone app which records location, elevation change and image of the various staircases throughout Pittsburgh.
This will document and visualize the location and state of decrepitude of Pittsburgh Public staircases.
Or, data may be gathered by myself of a series of stairs across pittsburgh describing slope, elevation change, etc.
Call of Duty stats vs Violent Crime
This correlation is based on my own excess of FPS hours logged and recent highly publicized acts of violent crime. This infographic would be intended to serve as a statement on the current state of affairs rather than a true correlation study (More Art than Statistics).
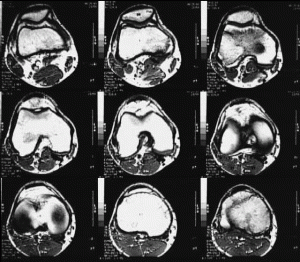
MRI cross sections
I’m not really sure how this data could be utilized as an infographic but I have access to MRI images (my own and others). k-space is the fourier transform of the input image data which is in turn reconstructed to create an output image. It would be intersting to see if this data could be reinterpreted not as an image but as a graphic providing visual data less legible in an image.


All of these are interesting and cool. Which one are you going with?
I’ve done a mechanical turk survey on 45 images of stairs throughout Pittsburgh. The data describes the stairs’ state of decrepitude. The infographic will have the raw data from the survey and the image files.