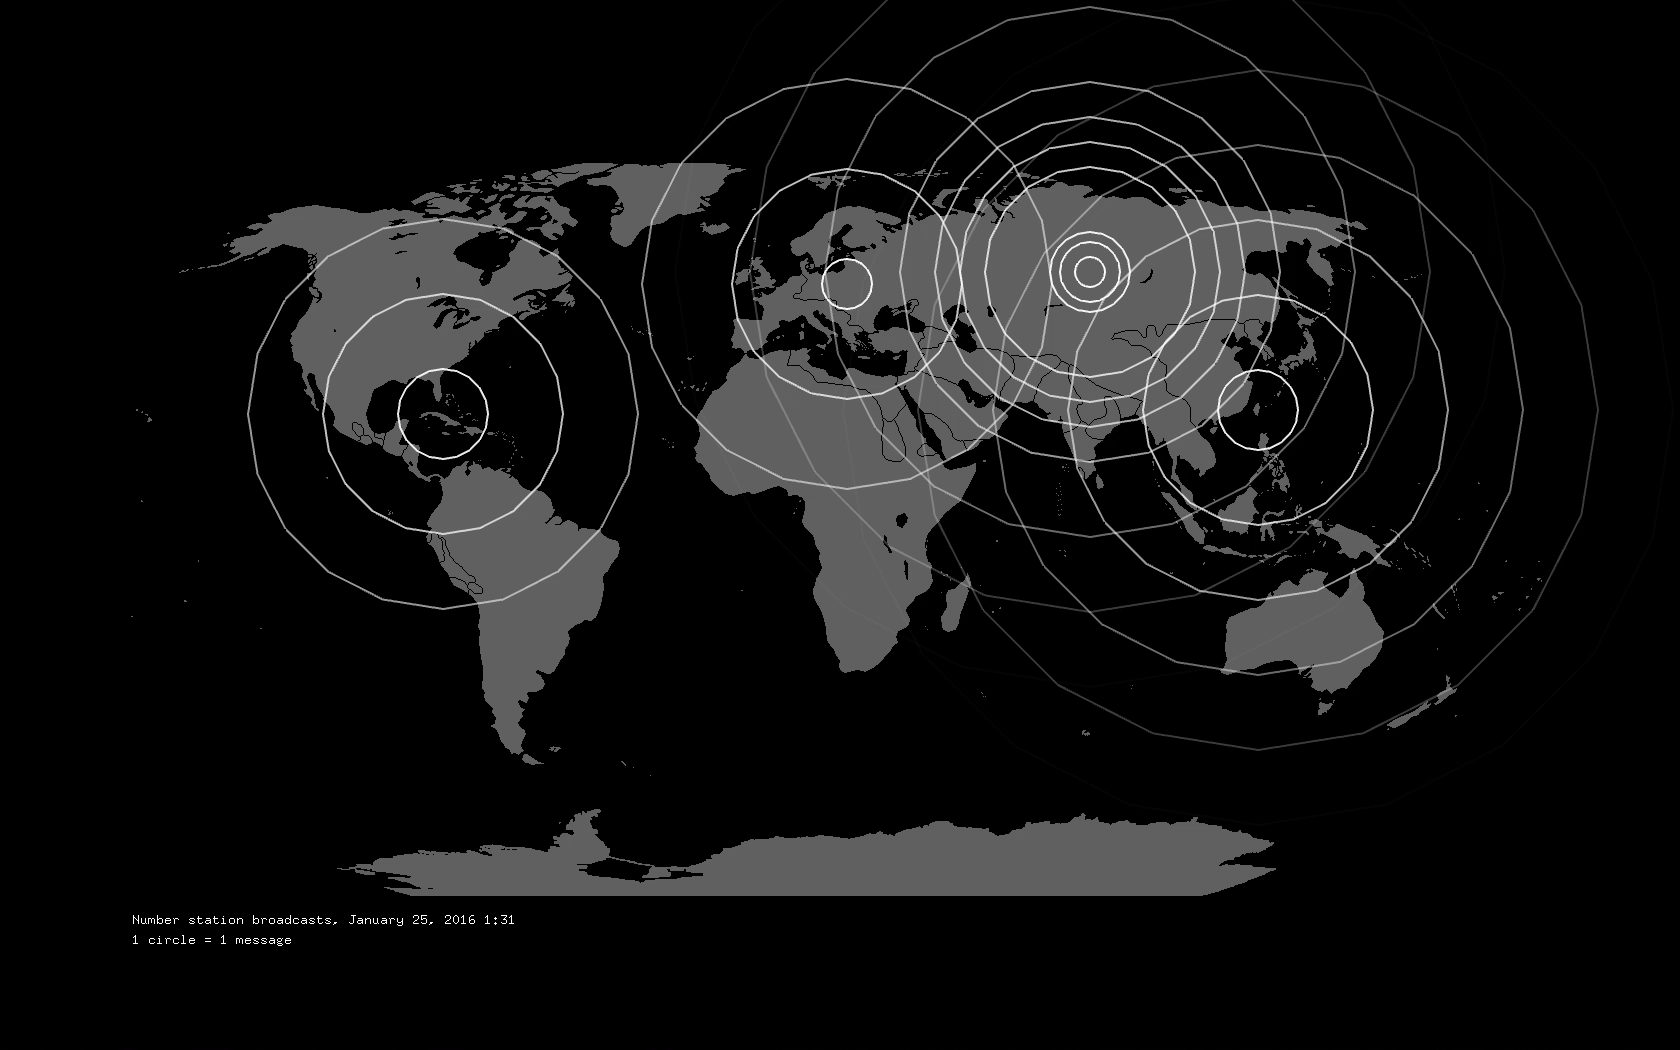
This number station map is an attempt at examining the invisible ecosystem of spy communication over shortwave radio waves. One message corresponds on the map to on blip and one circle, with each country sounding at a unique pitch. Through seeing and hearing each county’s transmission style at a compressed timescale, I wanted to see what kind of personality each entity might appear to have that would not be apparent just by looking at the data on a table.

Information comes from http://priyom.org, which includes a GCal of station broadcast schedules and a web database of station information. Broadcast schedule was downloaded using this GSheet script, and combined manually with location data from the web database. The map is an image from wikipedia, though I realize that in my haste to get a working version 1 I accidentally used a map with boundaries from 1 CE.