Earthquakes test from zach rispoli on Vimeo.
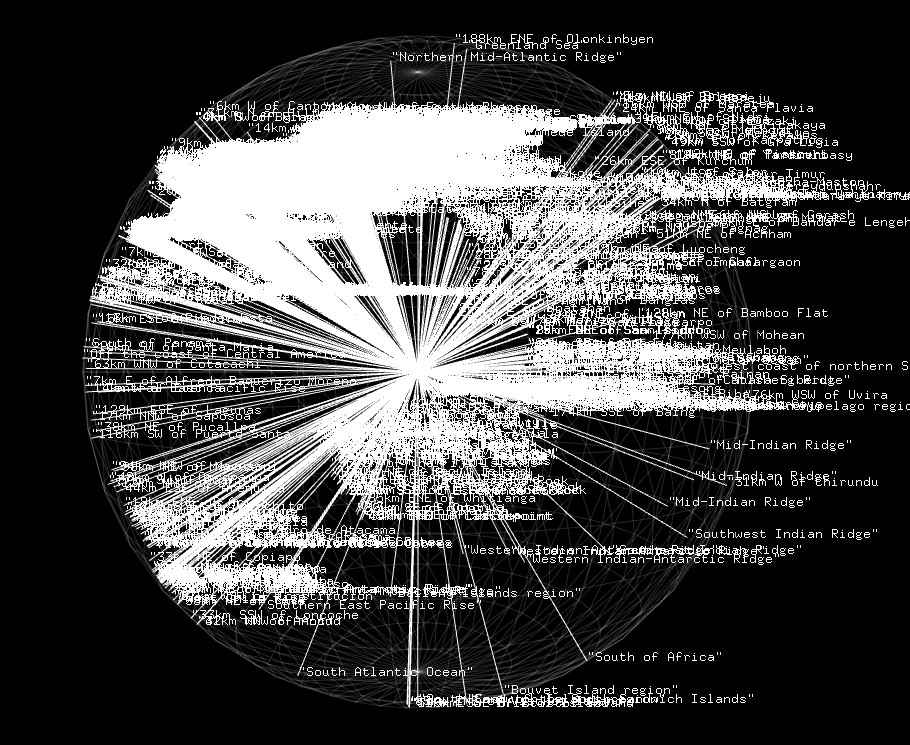
This is a model of the earth that has been dented wherever an earthquake has happened in the past ten years (over 100,000 earthquakes!).…
Earthquakes test from zach rispoli on Vimeo.
This is a model of the earth that has been dented wherever an earthquake has happened in the past ten years (over 100,000 earthquakes!).…
Part I. Two Addons in OF
For this part of the assignment, I only had time to do the base requirements, i.e. getting two addons to compile in the same project (as you can see if my beautiful output screenshot …

Irene Alvarado – Gauntlet – Maps
First map visualization
This was a really great opportunity to become familiarized with D3 and GeoJson, as much as I would have loved to have more time to expand my map. Again, I wanted …
For my map visualization, I chose to work with the meteor dataset. I wanted to make something 3d that showed meteor strikes over the surface of the globe. I also got the idea to involve an interactive time dimension, so …
For my Map visualization, I selected the meteorite strike data. The data was especially intriguing to me, since meteorite strikes are not something we actively thing about. I wanted to portray through a visualization that it actually happens, and the …
In order to cartographically represent the location of earthquakes from the last month around the world, I took the 3D image of a sphere and plotted earthquakes on it based on longitude and latitude. What I like most about this …
For my Maps assignment I created visualizations of the recorded earthquakes between December 15, 2015 – January 14, 2016.
“Map” Visualization
https://github.com/kevinmkarol/earthquake_lat_lon

Although this portion was more of a technical extension of work completed in class, I decided to …
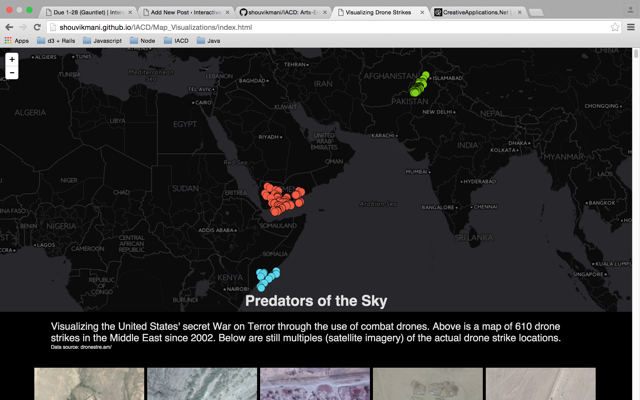
Map Visualizations: Predators of the Sky
Visualization: http://shouvikmani.github.io/IACD/Map_Visualizations/index.html


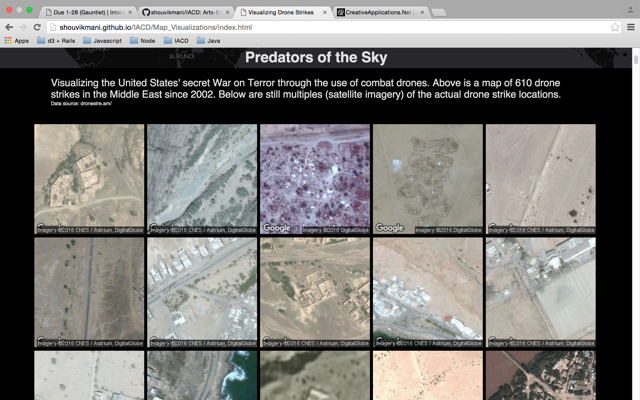
Initially, I was apprehensive about working with the drone strike dataset. I feared that a simple map or non-map visualization wouldn’t be able to convey the gravity of the subject. When you …
In mapping the impact of meteorites around the world, I thought it would be interesting to view the world from above the North Pole. I don’t know if most Earth-impacting meteorites travel in the orbital plane of the solar system …
The first part of this project was to pick a data set and then map it geographically. I chose the data set of close to half a million hotels world wide. There were two main reasons I picked this data …