Category Archives: Uncategorized

jackkoo

27 Jan 2015

downloaddownload (2)download (1)

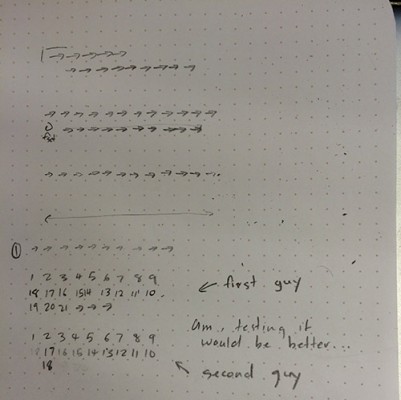
starts synced ->,                 synced  <-                         bottom guy turned first.

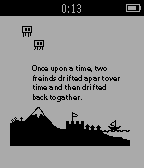
Hi this is my poem / timer.

Each row is 30 steps, and takes 30 seconds.

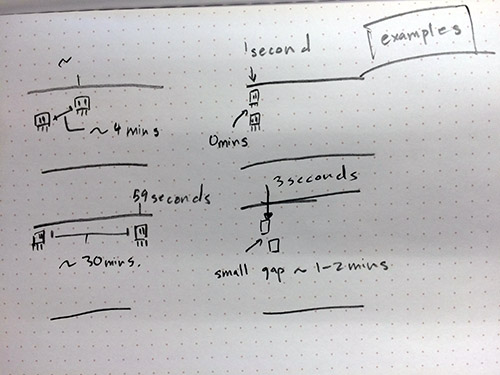
The return trip included makes it 1 minute per cycle. At each 59th step of the second being, he/she turns around before the 60th step. This causes a small gap that represents a minute.  Each round the characters’ gap increases once as more minutes are represented. This pattern eventually cycles though and returns to its default state. There can be a total of 60 gaps between them. Meaning that this piece can time up to exactly 1 hour.

It’s also a little poem about two friends separating and getting back together :D

Here is my sketch. and some explainationIMG_0032
IMG_0068

Here is my code!

#include <pebble.h>
#include <stdlib.h>
 
static Window *s_main_window;

int s_second = 0;
int s_second2 = 0;

bool direction1 = true;
bool direction2 = true;
bool isam = true;

static BitmapLayer *s_bg;
static GBitmap *s_bg_bitmap;

static BitmapLayer *s_sprite_minuite1;
bool s_sprite_minuite1_frame = true;
static BitmapLayer *s_sprite_minuite2;
bool s_sprite_minuite2_frame = true;

static GBitmap *s_sprite1f1_bitmap;
static GBitmap *s_sprite1f2_bitmap;

static GBitmap *s_sprite2f1_bitmap;
static GBitmap *s_sprite2f2_bitmap;

static GBitmap *s_spritef1_bitmap;
static GBitmap *s_spritef2_bitmap;
static GBitmap *s_spritef1L_bitmap;
static GBitmap *s_spritef2L_bitmap;

typedef struct vector2 vector2;

struct vector2
{
 float x;
 float y;
};
 
vector2 sprite1Position = {10, 10};
vector2 sprite2Position = {10 ,23};

bool animationFrame = false;

static PropertyAnimation *s_property_animation;
static PropertyAnimation *s_property_animation2;

static void destroy_property_animation(PropertyAnimation **prop_animation) {
 if (*prop_animation == NULL) {
 return;
 }

 if (animation_is_scheduled((Animation*) *prop_animation)) {
 animation_unschedule((Animation*) *prop_animation);
 }

 property_animation_destroy(*prop_animation);
 *prop_animation = NULL;
}

static void trigger_custom_animation() {
 
 
 destroy_property_animation(&s_property_animation);
 //*s_property_animation = NULL;
 destroy_property_animation(&s_property_animation2);
 //*s_property_animation2 = NULL;
 
 Layer *s_layer = bitmap_layer_get_layer(s_sprite_minuite1);
 Layer *s_layer2 = bitmap_layer_get_layer(s_sprite_minuite2);
 
 // Set start and end
 GRect from_frame = layer_get_frame(s_layer);
 GRect to_frame = GRect(sprite1Position.x, sprite1Position.y, 10, 11);
 
 GRect from_frame2 = layer_get_frame(s_layer2);
 GRect to_frame2 = GRect(sprite2Position.x, sprite2Position.y, 10, 11);
 
 // move first guy
 if (direction1 == true)
 {
 if (sprite1Position.x < 130)
 {
 sprite1Position.x += 4.0;
 }
 }else
 {
 if (sprite1Position.x > 10)
 {
 sprite1Position.x -= 4.0;
 }
 }
 
 if (direction2 == true)
 {
 if (sprite2Position.x < 130)
 {
 sprite2Position.x += 4.0;
 }
 }else
 {
 if (sprite2Position.x > 10)
 {
 sprite2Position.x -= 4.0;
 }
 }
 
 // Create the animation
 s_property_animation = property_animation_create_layer_frame(s_layer, &from_frame, &to_frame);
 s_property_animation2 = property_animation_create_layer_frame(s_layer2, &from_frame2, &to_frame2);
 
 // Flip the animations
 if (s_sprite_minuite1_frame)
 {
 bitmap_layer_set_bitmap (s_sprite_minuite1, s_sprite1f2_bitmap);
 s_sprite_minuite1_frame = !s_sprite_minuite1_frame;
 }
 else
 {
 bitmap_layer_set_bitmap (s_sprite_minuite1, s_sprite1f1_bitmap);
 s_sprite_minuite1_frame = !s_sprite_minuite1_frame;
 }
 
 // Flip the animations
 if (s_sprite_minuite2_frame)
 {
 bitmap_layer_set_bitmap (s_sprite_minuite2, s_sprite1f1_bitmap);
 s_sprite_minuite2_frame = !s_sprite_minuite2_frame;
 }
 else
 {
 bitmap_layer_set_bitmap (s_sprite_minuite2, s_sprite1f2_bitmap);
 s_sprite_minuite2_frame = !s_sprite_minuite2_frame;
 }

 
 // Schedule to occur ASAP with default settings
 animation_schedule((Animation*) s_property_animation);
 animation_schedule((Animation*) s_property_animation2);
}


static void main_window_load(Window *window) 
{
 // Sprite 1 textures
 s_spritef1_bitmap = gbitmap_create_with_resource(RESOURCE_ID_f1);
 s_spritef2_bitmap = gbitmap_create_with_resource(RESOURCE_ID_f2);

 s_spritef1L_bitmap = gbitmap_create_with_resource(RESOURCE_ID_f1L);
 s_spritef2L_bitmap = gbitmap_create_with_resource(RESOURCE_ID_f2L);

 // Sprite 1 Set initial
 s_sprite1f1_bitmap = s_spritef1_bitmap;
 s_sprite1f2_bitmap = s_spritef2_bitmap;
 
 // Sprite 2
 s_sprite2f1_bitmap = s_spritef1L_bitmap;
 s_sprite2f2_bitmap = s_spritef2L_bitmap;
 
 s_bg_bitmap = gbitmap_create_with_resource(RESOURCE_ID_bg);
 s_bg = bitmap_layer_create(GRect(10, 10, 120, 120));
 bitmap_layer_set_bitmap(s_bg, s_bg_bitmap);
 layer_add_child(window_get_root_layer(window), bitmap_layer_get_layer(s_bg));

 // Sprite Minuite 1
 s_sprite_minuite1 = bitmap_layer_create(GRect(0, 0, 10, 11));
 bitmap_layer_set_bitmap(s_sprite_minuite1, s_spritef1_bitmap);
 layer_add_child(window_get_root_layer(window), bitmap_layer_get_layer(s_sprite_minuite1));

 // Sprite Minuite 2
 s_sprite_minuite2 = bitmap_layer_create(GRect(0, 0, 10, 11));
 bitmap_layer_set_bitmap(s_sprite_minuite2, s_spritef1_bitmap);
 layer_add_child(window_get_root_layer(window), bitmap_layer_get_layer(s_sprite_minuite2));
}

static void main_window_unload(Window *window) {
 // Destroy TextLayer
}

static void tick_handler(struct tm *tick_time, TimeUnits units_changed)
{
 trigger_custom_animation();
 s_second = s_second + 1;
 
 // First sprite takes 30 steps, 30 steps
 if (s_second >= 30)
 {
 if (direction1)
 {
 s_sprite1f1_bitmap = s_spritef1L_bitmap;
 s_sprite1f2_bitmap = s_spritef2L_bitmap;
 }
 else
 {
 s_sprite1f1_bitmap = s_spritef1_bitmap;
 s_sprite1f2_bitmap = s_spritef2_bitmap;
 }
 direction1 = !direction1;
 s_second = 0;
 }
 
 // Second sprite takes 30 steps, 29 steps
 s_second2 = s_second2 + 1;
 if (s_second2 >= 29)
 {
 if (direction2)
 {
 if (s_second2 >= 30)
 {
 s_sprite2f1_bitmap = s_spritef1_bitmap;
 s_sprite2f2_bitmap = s_spritef2_bitmap;
 direction2 = !direction2;
 s_second2 = 0;
 }
 }
 else
 {
 s_sprite2f1_bitmap = s_spritef1L_bitmap;
 s_sprite2f2_bitmap = s_spritef2L_bitmap;
 direction2 = !direction2;
 s_second2 = 0;
 }
 }
 
}

static void init() {
 
 // Create main Window element and assign to pointer
 s_main_window = window_create();

 // Set handlers to manage the elements inside the Window
 window_set_window_handlers(s_main_window, (WindowHandlers) {
 .load = main_window_load,
 .unload = main_window_unload
 });

 // Show the Window on the watch, with animated=true
 window_stack_push(s_main_window, true);
 
 // Register with TickTimerService
 tick_timer_service_subscribe(SECOND_UNIT, tick_handler);
 
 trigger_custom_animation();
}

static void deinit() {
 // Destroy Window
 window_destroy(s_main_window);
}

int main(void) {
 init();
 app_event_loop();
 deinit();
}

Zack Aman

24 Jan 2015

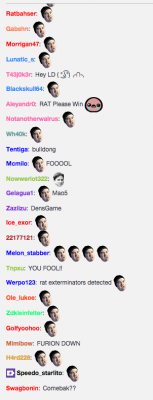
The data I chose to scrape is the chat from Twitch.tv, a website where people can stream themselves playing video games.  Specifically, I built an IRC bot to scrape the usage of emotes for a channel by minute.  The chat in some channels is notoriously rude, whereas others are mild and well-mannered.  As one viewer puts it, “this chat gives aids to cancer.”

Screen Shot 2015-01-22 at 12.01.27 PM

My end goal is visualizing, by minute, the emote usage of different channels and different games.  My hypothesis is that different games (and to a lesser extent channels within those games) will have their own emote dialect, emphasizing some more than others.  There are also spikes of specific emotes as everyone hops onto a message bandwagon, which might be interesting to visualize by number of distinct people that used that emote.

For this project, I learned how to build an IRC bot using Node.js which can look for keywords, tabulate the metrics, and write output back to the channel.  I used this approach because scraping the data from the DOM was not easy given the dynamic and ever-changing nature of chat.  In its current state I’m currently looking for five common emotes, but will expand it into the full list of twitch emotes as I move forward.

Code viewable on GitHub here.

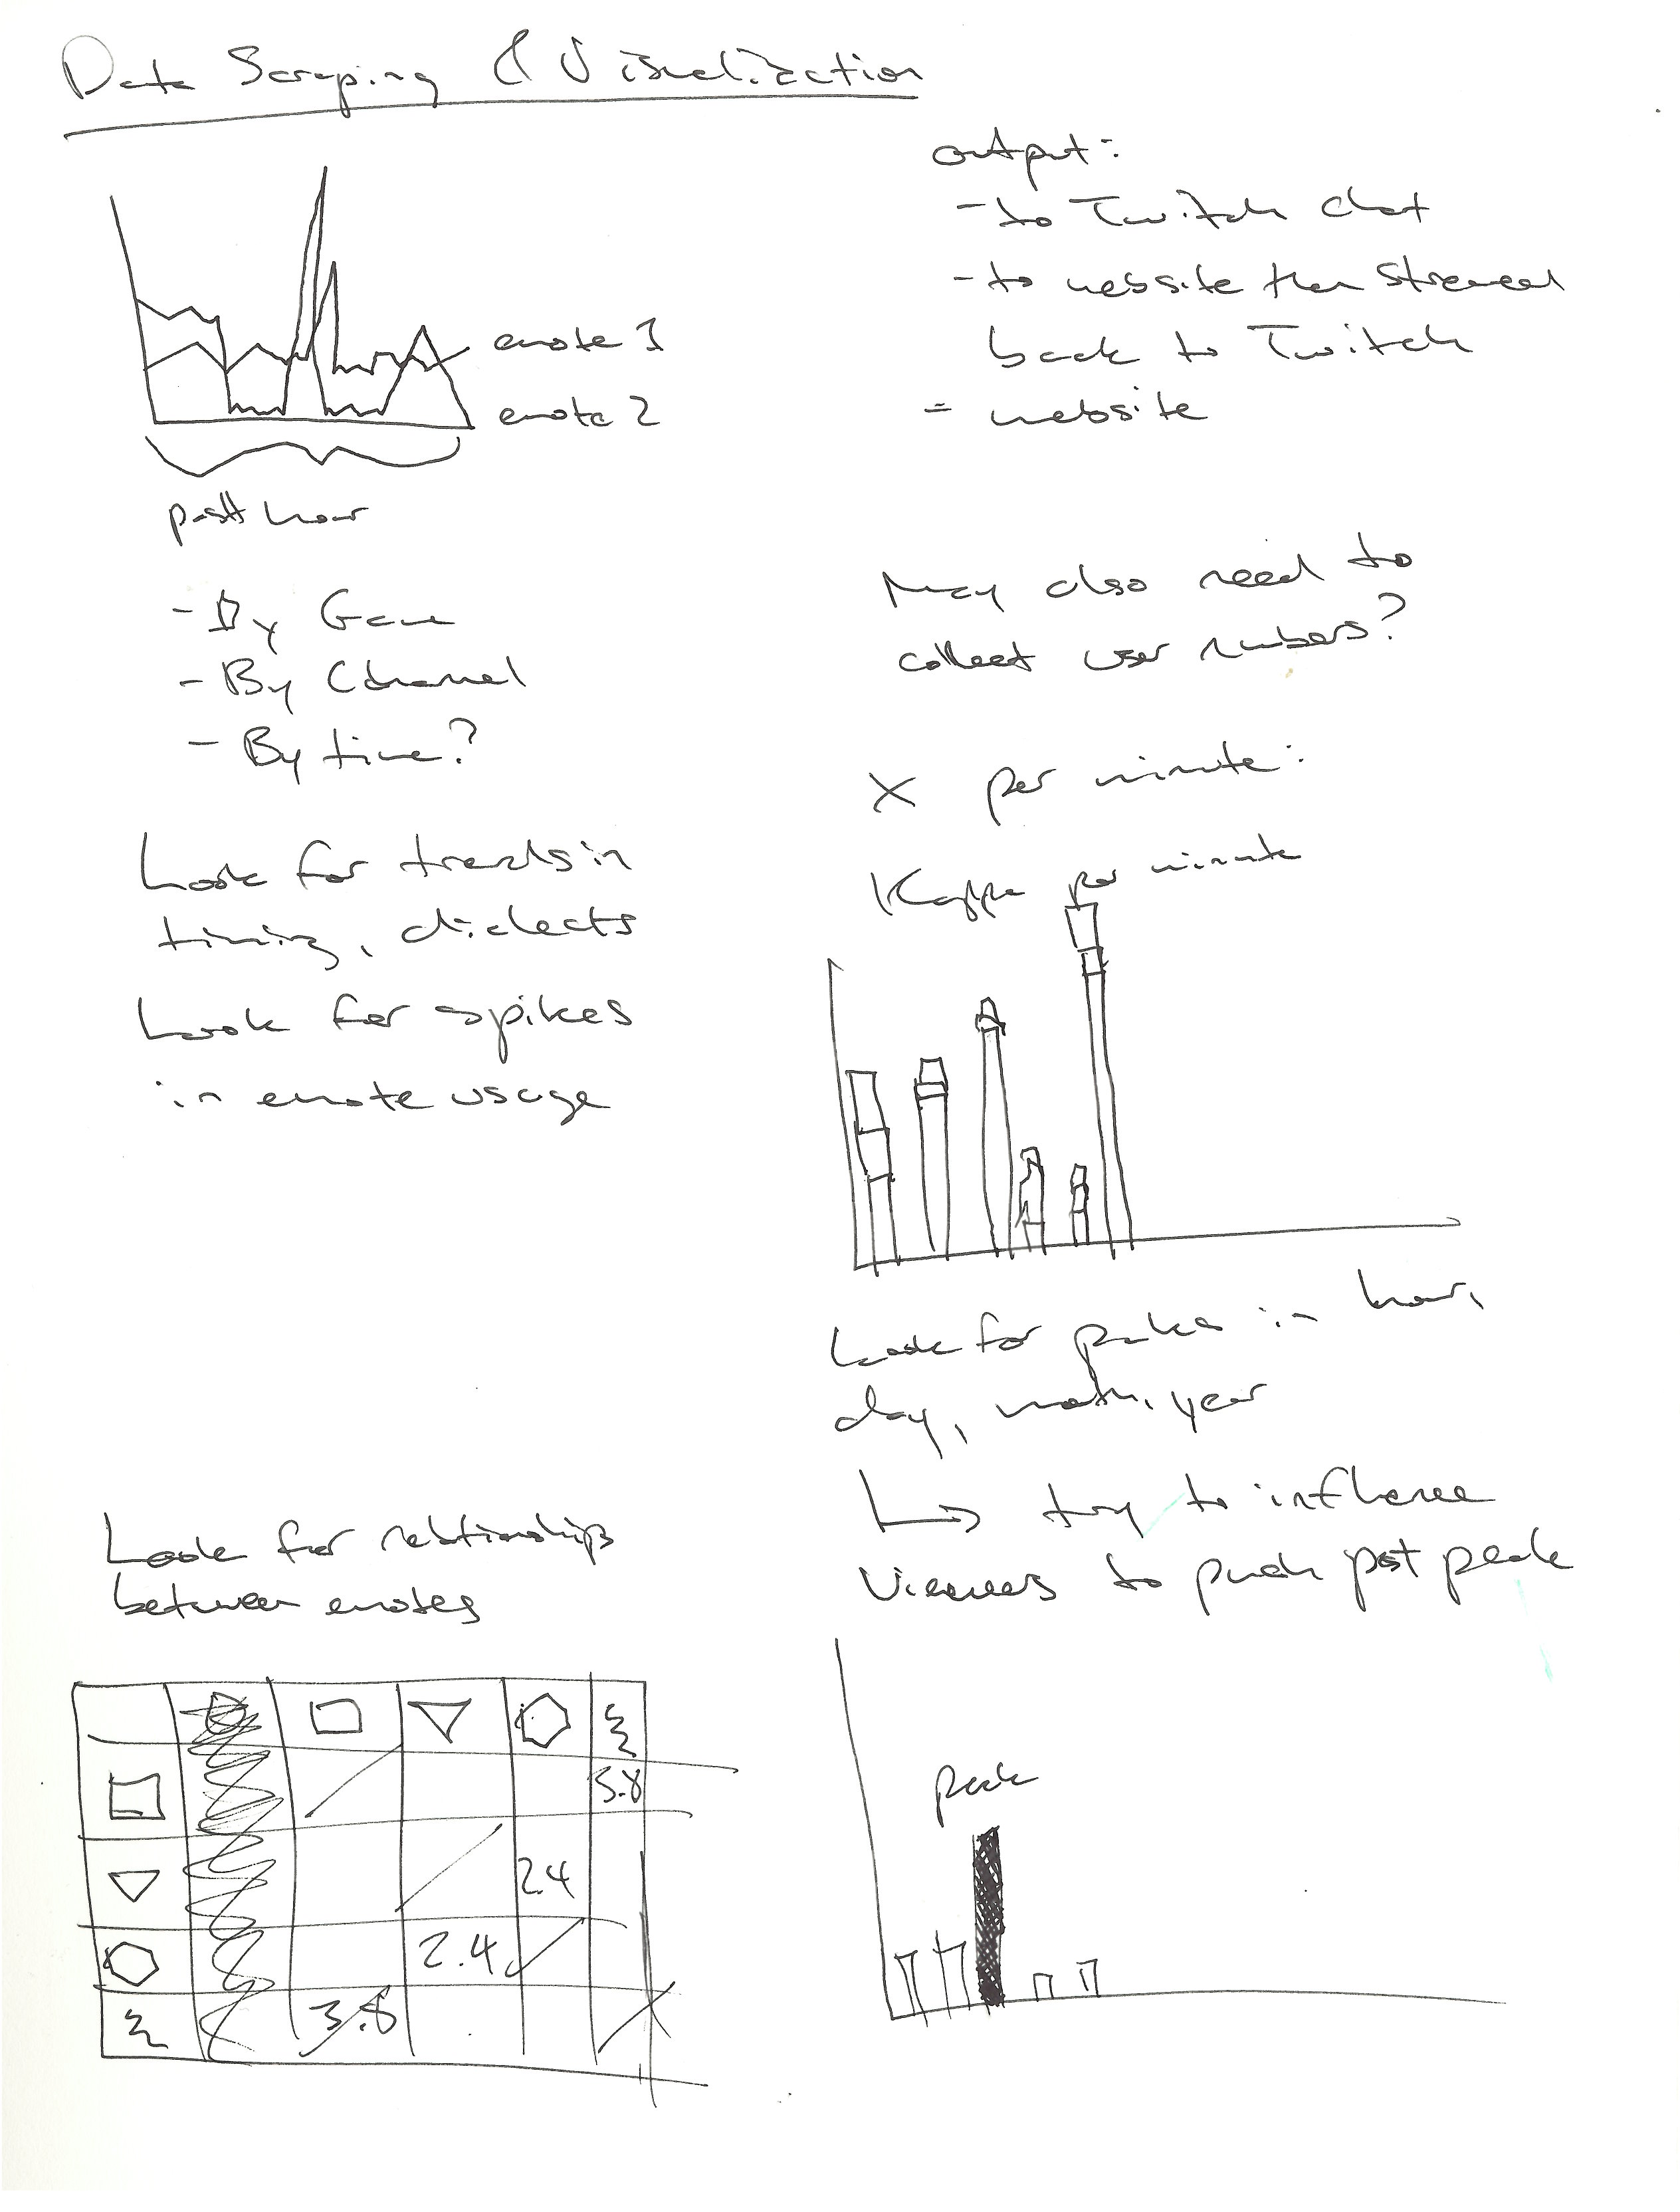
Rough sketch of visualization options and ideas:

There are a couple of things that I think would be interesting to visualize:

  • The correlation of different emotes within a channel (or within a game)
  • Look for some sort of “chat quality index” that might be calculated based on the emote usage or the amount of bandwagoning with single emotes and then graph this against game popularity and number of channel viewers.  My guess is that chat quality decreases with more viewers.
  • A split bar graph with emote per minute.  “Kappa per minute” is a common phrase on Twitch, but it would be interesting to show an actual graph of emote usage and identify peak emote speed within different contexts.
  • A line graph of emote usage would be good for clearly showing the spikes in usage.

Here is some sample data from chat of AmazHS playing Hearthstone.  There were roughly 30,000 viewers while I collected this data.

{
 "channel": "#amazhs",
 "timestamp": 1421943255095,
 "Kappa": 12,
 "EleGiggle": 0,
 "Kreygasm": 0,
 "fourhead": 2,
 "FrankerZ": 0
}
{
 "channel": "#amazhs",
 "timestamp": 1421943315312,
 "Kappa": 22,
 "EleGiggle": 1,
 "Kreygasm": 1,
 "fourhead": 0,
 "FrankerZ": 0
}
{
 "channel": "#amazhs",
 "timestamp": 1421943375523,
 "Kappa": 5,
 "EleGiggle": 0,
 "Kreygasm": 21,
 "fourhead": 3,
 "FrankerZ": 0
}
{
 "channel": "#amazhs",
 "timestamp": 1421943435693,
 "Kappa": 79,
 "EleGiggle": 0,
 "Kreygasm": 13,
 "fourhead": 0,
 "FrankerZ": 0
}
{
 "channel": "#amazhs",
 "timestamp": 1421943495919,
 "Kappa": 20,
 "EleGiggle": 0,
 "Kreygasm": 18,
 "fourhead": 2,
 "FrankerZ": 0
}
{
 "channel": "#amazhs",
 "timestamp": 1421943556087,
 "Kappa": 12,
 "EleGiggle": 0,
 "Kreygasm": 2,
 "fourhead": 0,
 "FrankerZ": 0
}
{
 "channel": "#amazhs",
 "timestamp": 1421943616276,
 "Kappa": 5,
 "EleGiggle": 0,
 "Kreygasm": 2,
 "fourhead": 0,
 "FrankerZ": 0
}
{
 "channel": "#amazhs",
 "timestamp": 1421943676460,
 "Kappa": 2,
 "EleGiggle": 0,
 "Kreygasm": 4,
 "fourhead": 0,
 "FrankerZ": 0
}
{
 "channel": "#amazhs",
 "timestamp": 1421943736668,
 "Kappa": 10,
 "EleGiggle": 1,
 "Kreygasm": 2,
 "fourhead": 1,
 "FrankerZ": 0
}
{
 "channel": "#amazhs",
 "timestamp": 1421943796875,
 "Kappa": 16,
 "EleGiggle": 2,
 "Kreygasm": 0,
 "fourhead": 2,
 "FrankerZ": 0
}
{
 "channel": "#amazhs",
 "timestamp": 1421943857058,
 "Kappa": 16,
 "EleGiggle": 1,
 "Kreygasm": 10,
 "fourhead": 3,
 "FrankerZ": 0
}

jackkoo

22 Jan 2015

sh2

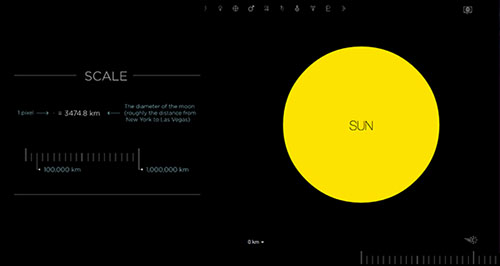
If the Moon were only 1 Pixel.

I found this piece from my friend when i mentioned that i saw 7billionworld.com. He told me have you seen “If the Moon were only 1 Pixel?”. The interesting piece about this information visualization is that it doesn’t take advantage of a large data set. The solar system only has so many planets. What it does emphasize via computing is the distance from each planet, and how long it takes for you to scroll from one planet to the next. For our assignments we were told use a large data set so that we don’t have a reason not to do it in illustrator instead. This piece is something that also can not be done in illustrator because of the size rather than quantity of information. This piece is more beautiful than 7 billion world since it plays with scale in multiple ways such as size and distance.

Screen Shot 2015-01-22 at 7.51.13 AM

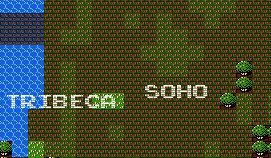
8 Bit Cities

I first saw this piece in a documentary called “Smash Brothers” about rivalry between gamers from the East and West coast. I didn’t really think of this piece as information visualization, and did not know it was even “generative”. I thought someone just created it as an “painting”. It wasn’t until I it on infoaesthetics that I thought more about this piece. The author claims that it changes the skin of New York (and other cities) to create and adventurous vibe. I do believe that vibe was apparent in the documentary of “Smash Brothers” by showing this specific map as the rivalry players were taking road trips and meeting people in different towns. What makes this piece interesting is that it didn’t change the information “more visible”, but rather reskinned it so that we view the same information with a different connotation.

sejalpopat

22 Jan 2015

Looking Outwards 2
Self-Illustrating Phenomena
https://graphics.stanford.edu/~hanrahan/talks/selfillustrating/

I’m really interested in data visualization but I don’t often think about/explore it in the context of research in the physical sciences. Pat Hanrahan gave an interesting talk at Stanford about “Self-Illustrating Phenomena”, which he essentially use as a way to talk about the goal of visualizations in general (“At a high-level: to convey information and to support reasoning. At a practical level: To create visualizations that scientists, engineers, doctors, analysts and ordinary people use everyday to solve problems; to build systems that increase their productivity and hopefully make their job easier.”). A self-illustrating phenomena, from what I gather, is basically an image of the affect some phenomena has on a real environment. This could be anything from “Chladni Waves” (shown below), which physically visualize sound, or a cloud/bubble chamber engineered specifically to reveal characteristics of particles. Hanrahan notes that the latter picture “tells the whole story using a very sophisticated visual language created by the underlying physics and the experimental design of the bubble chamber.” I think this is a really important way of looking at visualization; you create an environment designed to pick up certain features of an object/system and translate these properties into visual form. Usually I think of this in terms of coming up with some data to scrape from somewhere on the internet, and then choosing how to visually represent that on a screen.

Matthew Kellogg-Looking Outwards-2: Infographics

Tweetping

Franck Ernewein created this piece which displays a live display of all tweets worldwide. It shows the tweets as bright spots on a world map and also displays running statistics for tweets from different parts of the world.

http://tweetping.net/

I like it for a few reasons. The color choices he made make it feel sharp, elegant and techy, while also giving the feeling that the map is a night view and the tweet dots are lights. It is also dense enough with data in its lower partition to look like something incredibly serious. I also enjoy that the stats start from when you open the page, and given time you can aggregate a bright map that is unique to the time frame over which you’ve opened the page.

I feel this project was very well done. If any improvement could be suggested, it is that it is only real-time. Maybe if a function to view charts from other times, or to see how a timespan looks or changes on the graph existed, it could be more interesting. It may also be interesting to have an overlay with daylight on it to show what time of day it is everywhere.

Metrico

Metrico (by Digital Dreams) is a platform style game with dynamic levels based around gameplay. The graphics and level design are meant to look like infographics. I enjoy this project because it is and isn’t infographics and I enjoy the idea of bringing the aesthetic to a game. I also enjoy dynamic levels in games. For all of this to work together makes it a great project in my mind.

The numbers and variable pointers that update in the game showing you what is dynamic and changing helps make the game look more dynamic and makes the motion of those elements more reconcilable to me.

The tetrahedron landscape bothers me. The pointy structures seem odd and are inconsistent with the foreground cubes. They also seem to differ in color schemes. I feel the aesthetic could be more appealing if this were remedied.


Selfie City

Lev Manovich, Moritz Stefaner, Mehrdad Yazdani, Dominikus Baur and Alise Tifentale made Selfie City which is a piece where they have collected thousands of “selfies” from a few different cities and some statistics about them. Some of these statistics are based on research (age and location, and maybe gender), and others based on facial recognition software.

I like this piece because of the interactive nature. The interface updates to show you what portions change based on the filtered data set (in green). This gives a good representation of relational statistics. For instance, I noticed that women tend to tilt their heads more so than men in selfies.

I also appreciate the real-time update of pictures, and the clean look of the user interface.

To improve this piece, I would like to see more data, as this feels like a very limited sample set of the world, and better facial recognition software because I noticed that many open mouth images were not actually images of people with open mouths.

http://selfiecity.net/