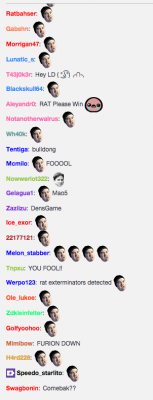
The data I chose to scrape is the chat from Twitch.tv, a website where people can stream themselves playing video games. Specifically, I built an IRC bot to scrape the usage of emotes for a channel by minute. The chat in some channels is notoriously rude, whereas others are mild and well-mannered. As one viewer puts it, “this chat gives aids to cancer.”
My end goal is visualizing, by minute, the emote usage of different channels and different games. My hypothesis is that different games (and to a lesser extent channels within those games) will have their own emote dialect, emphasizing some more than others. There are also spikes of specific emotes as everyone hops onto a message bandwagon, which might be interesting to visualize by number of distinct people that used that emote.
For this project, I learned how to build an IRC bot using Node.js which can look for keywords, tabulate the metrics, and write output back to the channel. I used this approach because scraping the data from the DOM was not easy given the dynamic and ever-changing nature of chat. In its current state I’m currently looking for five common emotes, but will expand it into the full list of twitch emotes as I move forward.
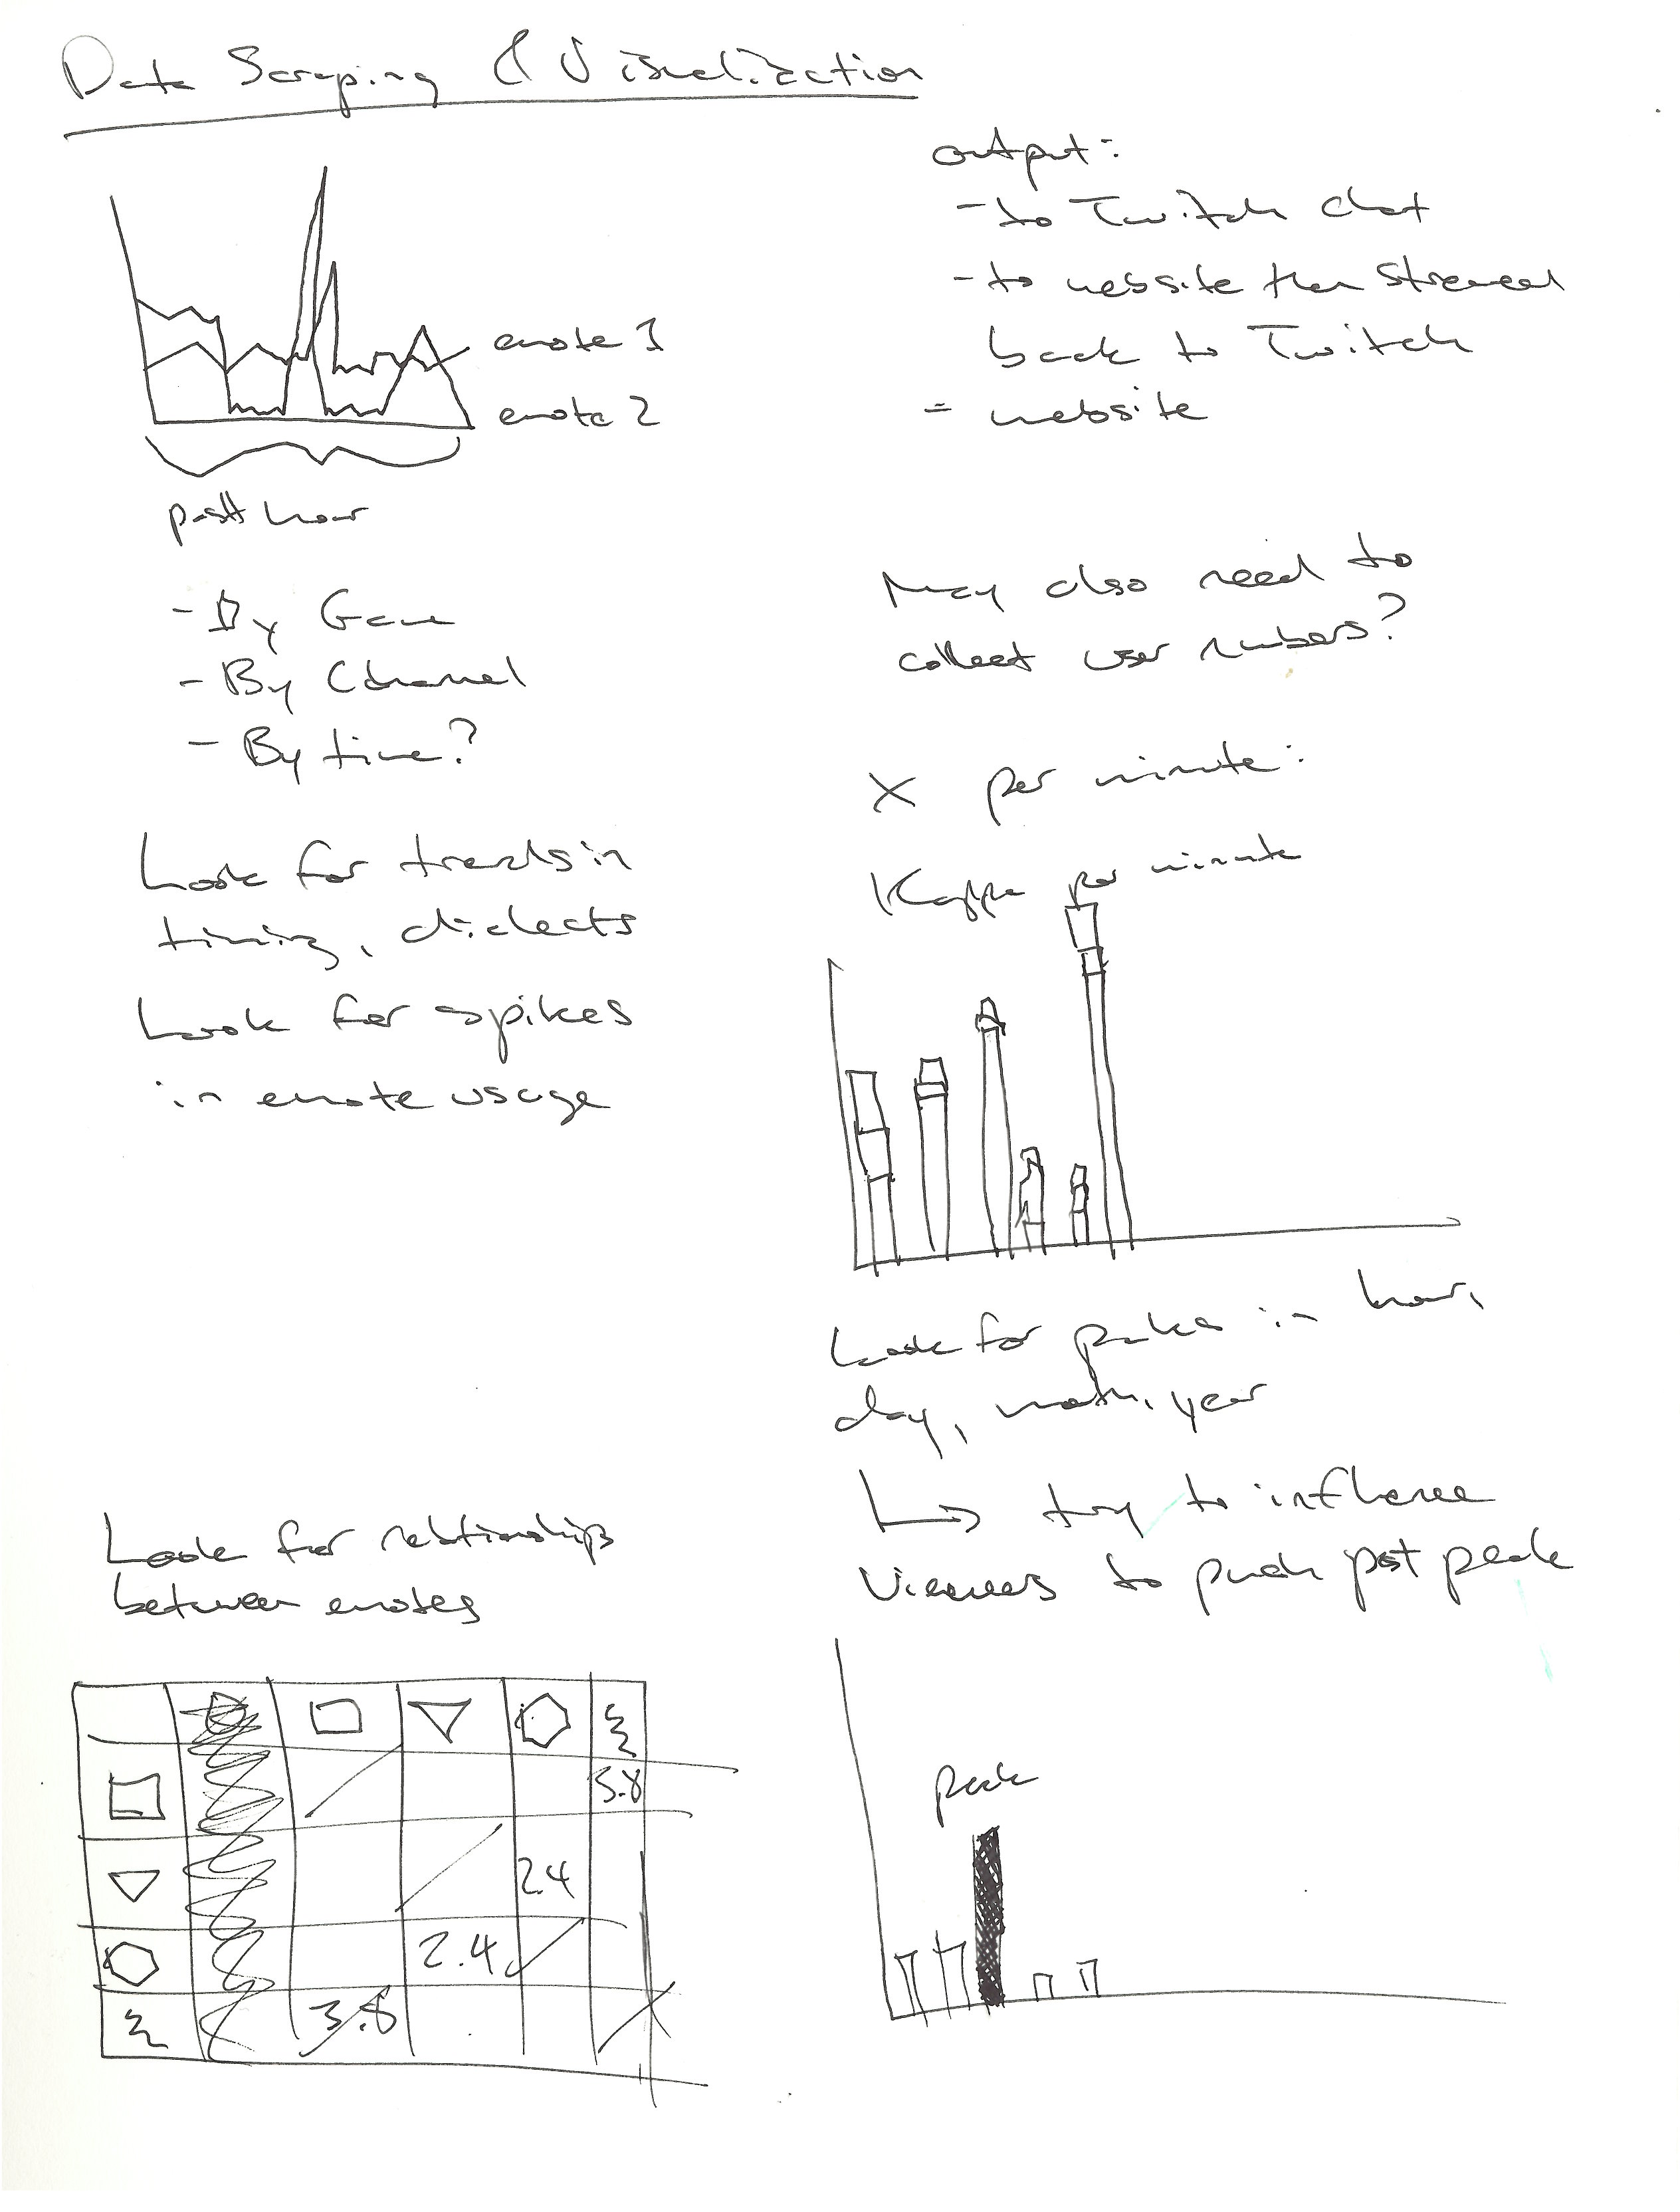
Rough sketch of visualization options and ideas:

There are a couple of things that I think would be interesting to visualize:
- The correlation of different emotes within a channel (or within a game)
- Look for some sort of “chat quality index” that might be calculated based on the emote usage or the amount of bandwagoning with single emotes and then graph this against game popularity and number of channel viewers. My guess is that chat quality decreases with more viewers.
- A split bar graph with emote per minute. “Kappa per minute” is a common phrase on Twitch, but it would be interesting to show an actual graph of emote usage and identify peak emote speed within different contexts.
- A line graph of emote usage would be good for clearly showing the spikes in usage.
Here is some sample data from chat of AmazHS playing Hearthstone. There were roughly 30,000 viewers while I collected this data.
{
 "channel": "#amazhs",
 "timestamp": 1421943255095,
 "Kappa": 12,
 "EleGiggle": 0,
 "Kreygasm": 0,
 "fourhead": 2,
 "FrankerZ": 0
}
{
 "channel": "#amazhs",
 "timestamp": 1421943315312,
 "Kappa": 22,
 "EleGiggle": 1,
 "Kreygasm": 1,
 "fourhead": 0,
 "FrankerZ": 0
}
{
 "channel": "#amazhs",
 "timestamp": 1421943375523,
 "Kappa": 5,
 "EleGiggle": 0,
 "Kreygasm": 21,
 "fourhead": 3,
 "FrankerZ": 0
}
{
 "channel": "#amazhs",
 "timestamp": 1421943435693,
 "Kappa": 79,
 "EleGiggle": 0,
 "Kreygasm": 13,
 "fourhead": 0,
 "FrankerZ": 0
}
{
 "channel": "#amazhs",
 "timestamp": 1421943495919,
 "Kappa": 20,
 "EleGiggle": 0,
 "Kreygasm": 18,
 "fourhead": 2,
 "FrankerZ": 0
}
{
 "channel": "#amazhs",
 "timestamp": 1421943556087,
 "Kappa": 12,
 "EleGiggle": 0,
 "Kreygasm": 2,
 "fourhead": 0,
 "FrankerZ": 0
}
{
 "channel": "#amazhs",
 "timestamp": 1421943616276,
 "Kappa": 5,
 "EleGiggle": 0,
 "Kreygasm": 2,
 "fourhead": 0,
 "FrankerZ": 0
}
{
 "channel": "#amazhs",
 "timestamp": 1421943676460,
 "Kappa": 2,
 "EleGiggle": 0,
 "Kreygasm": 4,
 "fourhead": 0,
 "FrankerZ": 0
}
{
 "channel": "#amazhs",
 "timestamp": 1421943736668,
 "Kappa": 10,
 "EleGiggle": 1,
 "Kreygasm": 2,
 "fourhead": 1,
 "FrankerZ": 0
}
{
 "channel": "#amazhs",
 "timestamp": 1421943796875,
 "Kappa": 16,
 "EleGiggle": 2,
 "Kreygasm": 0,
 "fourhead": 2,
 "FrankerZ": 0
}
{
 "channel": "#amazhs",
 "timestamp": 1421943857058,
 "Kappa": 16,
 "EleGiggle": 1,
 "Kreygasm": 10,
 "fourhead": 3,
 "FrankerZ": 0
}
