I scraped some Walkscore data. Walkscore is a website that tells you how walkable a certain address is. (“Walkable” means you can get to shops, restaurants, public resources, whatever else you need reasonably well by walking.) I’m interested in how walkability correlates with other factors of a city such as schools, socioeconomic status, and crime.
The data is a 0.1 degree latitude and longitude “square” around Pittsburgh’s center (40.441667, -80), sampled at approximately 0.005 degree increments. I say “approximately” because when you submit a query to the Walkscore API, it “snaps” it to the nearest lat/lon point in their database, which are not exactly on 0.005 degree increments. They’re close, though; at 40 degrees north, 0.005 degrees latitude is about 1821 feet (longitude: 1391 ft), and they advertise that their grid is about 500 feet between points. It would be nice to sample every 500 feet (about 0.001 degrees) but that would take too many queries: .005 degree increments for a 0.2 degree range = 1600 queries, .002 degree increments = 10,000 queries, .001 degree increments = 40,000 queries. Their rate limit is 5000/day.
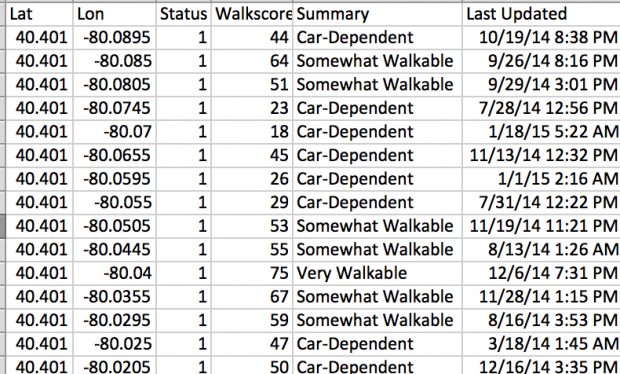
Anyway, here’s a slice of the data:
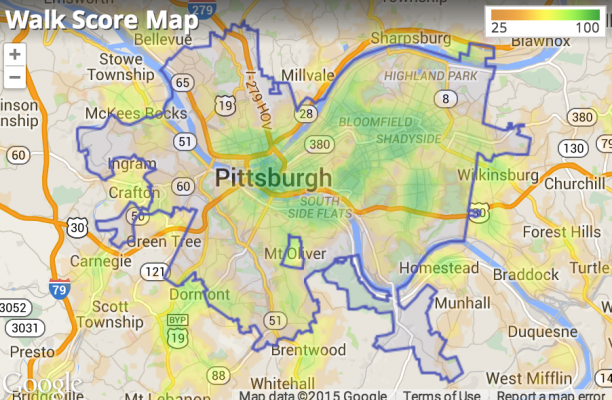
Ways I might visualize it: good question. The easy thing that comes to mind is a heat map, which they’ve already done (greener = higher walkscore):
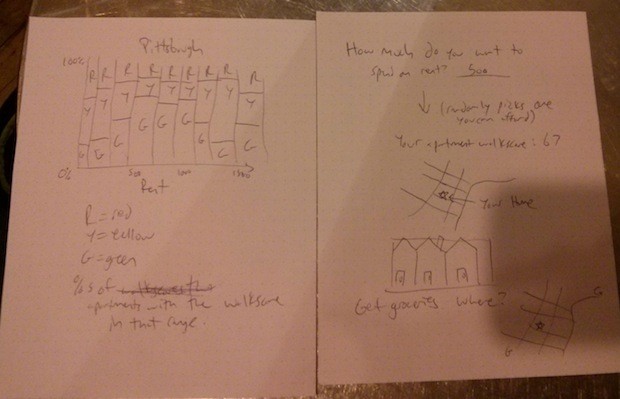
I could also do various different heatmaps (heatmap of “walkscore minus crime”, heatmap of “walkscore + instagram posts” etc) but that’s not super exciting either. One idea: get a bunch of real estate/rent listings, show how many at each price point are how walkable.
Another thing I’m thinking is, a big geo data set might be easier to explore in slices, one point at a time. What about street view photos from the most walkable places? What about an experience like Spent – you put in how much you want to pay in rent, then you have to make a series of decisions about where you’ll get groceries, where you’ll get your car fixed (if you have one), etc. The point I’m trying to make is that walkability is, in a way, a civil rights issue. Maybe that’s too simple. Sketches of both ideas below:
Code is in github here. Data’s there too, actually, because it’s pretty small.


