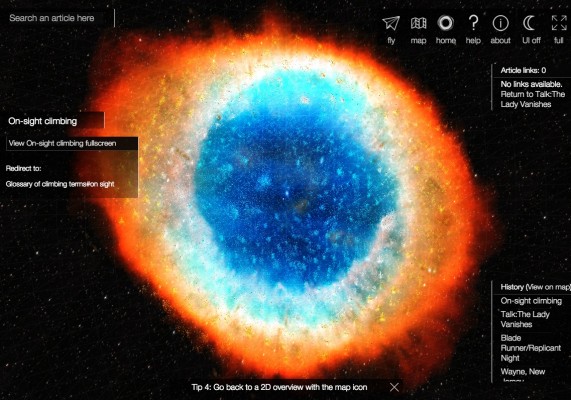
WikiGalaxy is a browser-based interactive visualization of Wikipedia, stylized as a cluster of stars. I thought this project was sort of interesting (although things like it have been done before) but I’m a sucker for things related to space, so it caught my eye. I’ve always wondered if at some point someone will develop a network-like interface like this that works well enough to replace the system of viewing one page at a time and following links which the internet currently exists as. This sort of system is good for visualizing relationships between lots of objects – a really good example of this is RedditViz, which is a map of all of the subreddits on Reddit. You can easily make out different communities which can be playfully personified as islands or countries (in this case, there’s a uncomfortably large NSFW peninsula as well as an isolated Brony Island…).
I haven’t yet seen a map like this which can be used to not only visualize, but to be used to browse through information. WikiGalaxy is interesting to look at, but isn’t really viable for browsing Wikipedia with.
(also the project is supposed to be a galaxy, but the image they used is of the Ring Nebula which is most certainly not a galaxy)
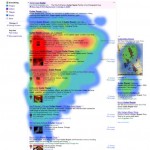
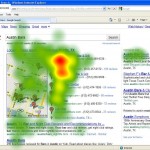
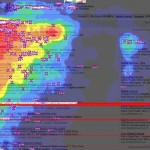
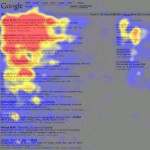
Another visualization-related thing I found interesting were these heatmaps generated by tracking the eyes of Google users. I think they’re sort of strange, almost like mold was beginning to grow on the page as the user’s gaze moved over it. Heatmaps in general are fascinating because they seem so data driven and digital but also so creepy and organic. I really want to do a project involving heatmaps at some point.
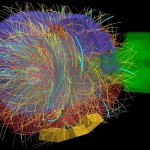
I also really want to do something visually similar to these physics experiment visualizations by CERN – some of these are massive, complex experiments done to try to find the Higgs Boson (nicknamed the God Particle – which reminded me of the religious proto-chemistry of 14th/15th century alchemy).
