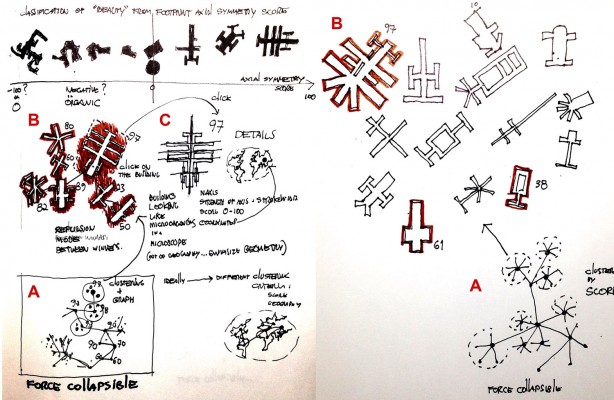
My data visualization project is a necessary reference for my capstone proposal. Originally, I was investigating the possibility of an interactive system that allowed the analysis of building footprints. This analysis would be the base to take the buildings out of their context and propose a remapping. In order to focus on visualization, I amplified my data set and produced static remapping of different cities based on a ranking of different shape metrics related to dispersion or regularity.
The capstone proposal will try to go back to the origins of this investigation and will reformulate the idea of remapping.
[here should be the new sketch, but the blog is not loading….]
Based on the visualization of the osm file in the processing environment, the user would be able to analyse and reformulate the organization of the buildings. The buildings will be stored in specific classes containing not only its own geometrical elements but also the characteristics of their shapes. Well, this is the basic idea, but there are still many branches to choose. Once these branches will demand different algorithms and approaches to the problem, I decided to use this post as a place to make this intersection explicit.
These are some 2 divergent general approaches to the problem:
a Interactivity: there will be many event-based functions to allow the user to choose specific buildings and specific shape metrics to organize a new map in parallel.
b “Generativity”: a more complex algorithm will be used to generate automatically a new map based on multi-dimensional shape metrics. Probably all the map will be analysed as a whole.
c Some place between? This would be the ideal, but probably the least feasible.
There are some possible types of map:
1 1d and 2d ranking: creates a precise position for each building in the new space based on its properties.
2 Pack, puzzle or collage: the agglomeration of the building based on the boundary and the neighbours.
3 Graph + attraction + repulsion: a general data-structure to cluster and organize the buildings in the new map. Probably this is the best data-structure + algorithm to balance interaction and generativity.
4 Self-Organizing feature map / Kohonen map: a artificial neural network able to convert high-dimensional data to low dimensional space (such as the modular maps) with weight vectors. It generates a complete new territory.
