Tweet summary: Find out how much of your neighborhood is Place, and how much is Dead Space. (or Non-Place.)
Jane Jacobs talks about density as a key feature of lively neighborhoods. It makes them fun to walk around, which makes them accessible, democratic, interesting, and affordable. Duany, Plater-Zyberk, and Speck write about how you need at least 15 dwellings per acre to support buses every 10 minutes. Downtown Cleveland is hard to get around, while Pittsburgh does all right. Density is important. But how do we measure density?
- people per acre: nope, maximizing people-per-acre gets us the Kowloon Walled City.
- dwellings per acre: getting better; I examined that in a previous project. But we can’t really feel “100 dwellings per acre” or “30 dwellings per acre.” What do those mean? And what about areas like downtown Manhattan that have few residents, but bustle with life?
- percent useful space: That’d be nice, but how do we do it?
Andrew Price gives it a try. Hard to tell much about this slice of Phoenix from the air: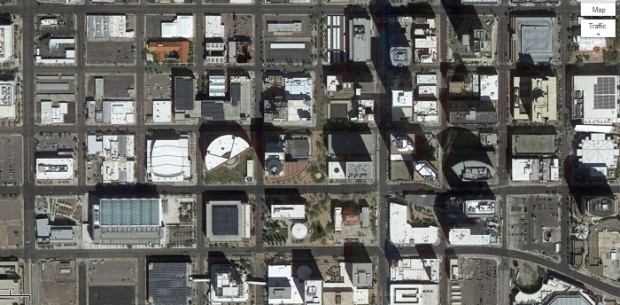 But if you look at what’s actually here, you’ve really got about 50% dead space, including roads, parking lots, and other places that are not really made for humans. He’s colored it all red (non-place) and blue (place):
 This would not be a ton of fun to walk around. And looking at it in this light helps us distill a vision of how cities could be. Less of that, more of this (San Francisco):
But the problem is that Price has to draw each of these things by hand. I feel like this could be auto-generated, which leads to what I’ll actually make: a web app. You go to the site, put in your location, and it shows you both the satellite map and this place/non-place layer. Hopefully you can draw a polygon (say, of your neighborhood) and it’ll tell you how much is place or non-place inside that.
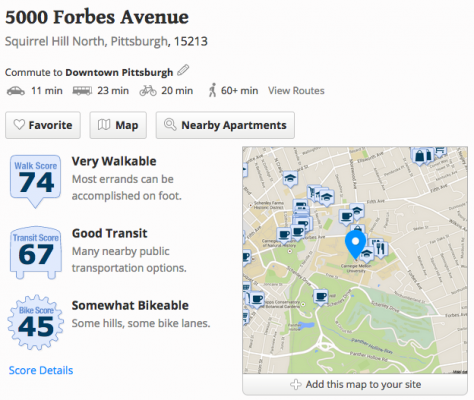
So what? It’s just a number, right? Well, so is Walkscore:
and yet, that’s become a valuable tool for deciding where to live, where to put an office, and maybe even where to put urban improvements. It would help our discourse be more concise if you could say “the problem with your plan for the new development is that it’d be 82% Non-Place.”
How to do it? Two main data sources:
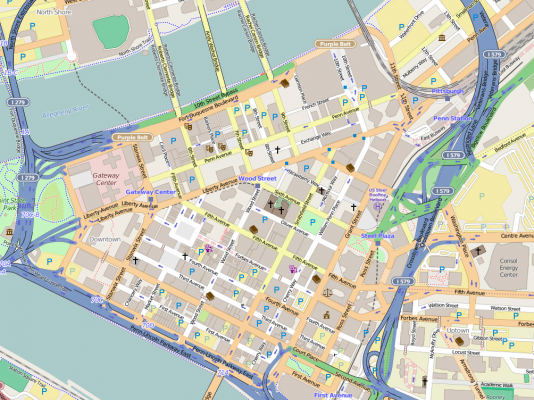
- building data from OpenStreetMap. OSM has some building data – not a ton, but it works if you’re looking downtown.
- Satellite imagery, from Landsat 8. (More info) Contains not only satellite photos, but also infrared and other invisible data bands. As a result, we can get data about surface heat and other properties that may tell us more about what each place actually is.
