Category Archives: CapstoneProposal

John Choi

23 Mar 2015

UPDATED Project Idea:  A posable crab figure to control a virtual crab simulator.

So, instead of making a universal humanoid action figure controller to control first-person and third person video games, I’m going to make a posable crab figure that can control only one game (which I will create).  So this is basically going to be a 4-legged, 12 degree of freedom (3 per leg) toy that hooks up electronically to your computer, communicating in real time via Arduino to a Unity application through Standard Firmata.  The idea of the actual game is that you control a crab and make it move by actually moving the real crab figure’s legs.

————–(Previous Information Below)—————–

Capstone Project Idea:  An action figure that can be used to control first-person shooter video games.

Here is a concept sketch:

The basic idea for this project is to develop a novel video game controller in the shape of an action figure.  Key motions can be mapped using standard 3-pin potentiometers.  Additional motions can be mapped using the joystick and the buttons laid throughout the figure.  The key difference between this project and the projects described below is that my project is designed to work as a video game controller rather than an electronic mannequin for animation.  This means focus will be placed on durability and ease of access to inputs.  While this will be certainly more difficult to use when compared to traditional game controllers, the action figure shape is hypothesized to bring a completely different kind of immersion to video games, where the player is not just pushing arbitrary buttons to control a game character, but instead directly controlling the character via pose control.  The plan in constructing this is that major components will be soldered onto 3D printed parts and run on an Arduino, interfacing with Processing to control a video game in real time.

This is very similar to a couple other projects I’ve found, which are:

Tangible Augmented Reality Action Figure by Alcyone, 2013

This is basically a posable figure with a bunch of fiducial markers for joints.  An augmented reality camera processed by a computer shows a virtual figure with the same joint orientations as the action figure in real time.  Additional interfaces such as a virtual reality device will allow the user to interface with the digital 3D figure like an actual pet.  A big advantage this project has over other augmented reality applications is that here you can actually touch the figure, which the digital representation can respond accordingly.

QUMA by SoftEther, 2011

I mentioned this in my first Looking Outwards post.  Instead of using fiducial markers to track joint poses, this project uses standard potentiometers.  With more than 20 degrees of freedom, this is an electronic mannequin that interfaces with a computer via USB and can be used to pose and animate 3D humanoid characters.

Modular Input Puppet by ETH Zurich, 2014

I also mentioned this in my first Looking Outwards post.  This is very similar to the above project, except that this project is modular, which basically means that the figure can be reconstructed to fit any skeleton, not only humanoids.  This great in that the modular system can be used to animate elephants, spiders, and even dinosaurs (like in Jurassic Park).


Alex Sciuto

23 Mar 2015

Projects – State of the Union

The 2007 State of the Union Address, NYTimes 2007
Patterns of Speech: 75 Years of the State of the Union Addresses, NYTimes 2011
The State of Our Union, Tweeted, NYTimes 2015 (not a graphic, but interesting data source)
Graphic: Shortest to longest State of the Union addresses, USA Today 2015
The Language of the State of the Union, the Atlantic 2015
#SOTU2014: See the State of The Union address minute by minute on Twitter, Twitter 2014
The state of our union is … dumber, The Guardian 2013
Hindsight is 20/20, Luke Dubois

Projects – Text Visualization

Visualizing Repetition in Text, Univ. Toronto 2007
On the Origin of Species: The Preservation of Favoured Traces, Ben Fry 2009
Text Visualization, Lionel Michel 2009
Visualizing the text of (children’s) book series: Visualizations, Microsoft Research
State of the Unions, Jer Thorp for the NYTimes, 2011
WE ARE BEGINNING TO SEE POSITIVE SIGNS FOR OUR INDUSTRY — BEAR STEARNS, LEHMAN BROTHERS, FREDDIE MAC & FANNY MAE: 1984-2009, Jer Thorp 2009
Software Evolution Storylines, Ogawa and Mu 2010

Tweetable Summary

Explore 200 years of American history through the words of American president’s State of the Union Address.

Analysis

There is an opportunity to do a text visualization of the State of the Union speeches and letters that closely connects and displays presidents’ individual words with measurements of the uniqueness of those words. Most mainstream visualizations of State of the Union text, focus on providing summary statistics of interesting words and their locations. Most of these visualizations miss higher level sentence and paragraph analysis as well as hide the president’s actual words.

Showing summary data removes the immediacy of the speeches as well a removes the context that the presidents were writing in.

Preliminary Code

Below are screenshots of an exploratory visualization that plots Google n-gram data and notes when the same n-gram appears in a State of the Union speech. I would like to use n-gram data, but random n-grams pulled from State of the Union speeches are not interesting to view. Only carefully selected phrases yield an interesting picture.

sotu-ngram

Below is another code exploration that uses layers of text to explore how phrases have been used used over time. I like this concept a lot because it brings the actual sentences to the forefront. The layered visualization is a bit over-the-top but it would work effectively to transition between speeches.

layers


Thomas Langerak

23 Mar 2015

An encrypter and decrypter installation. Key is based on a chess game. One needs to replay the chess game to decipher the message.

Project:

The start of the project was me thinking, well I like cryptography and trying to think of concepts around this. When this did not really succeeded I thought: well I like chess as well. After a few minutes I concluded that I could combine both to create something fun and not necessarily functional.

I am going to make a chess game out of Perspex in which the black squares are see through and the white squares have a laser-engraved/sandblasted kind of look. I will illuminate the white tiles by using a beamer from underneath. This beamer will also be used to visualize the message and the process of encrypting and decrypting.

The movement of the pieces will be tracked by an RasberryPi camera detecting IR. The bottom of each piece will be IR reflective. Since one does not need to know which is piece is which (since they always start out at the same position), one can just track moves and by doing so know the position on the board of each individual piece.

As said above I will use the white/opaque squares to beam something on. This something is the message that will be encrypted/decrypted. I want to visualize the stage of this encryption/decryption by making the message more/less clear. I still have to figure out the details and aesthetics of this.

wp_20150323_23_14_51_pro

Process

  1. Get OFX on raspberry pi working
  2. Create chessboard (projector and hardware)
  3. Program computer vision to track chess pieces
  4. Store location of pieces
  5. Check location with stored
    1. If Yes make message bit more clear
    2. If No BANG! Start over
  6. I also should work on the visualization sometime

Questions with regard to project:

What to encrypt/decrypt?
A random written message

How to input what should be encrypted?
Marker on chessboard -> Picture -> Erase it?

Will the encryption and decryption happen at the same location?
For this assignment yes.

How to output the message?
User the projector to display it on the chessboard?

How to visualize the process?
How to encrypt it?
I don’t really need it do I?

Should I automate the opponent?

Lot of work, not necessary, but better… Only when I have time
How to “end” the encryption process and start the decryption process?

Hardware:

Adafruit:

Raspberry Pi 2 – Model B – ARMv7 with 1G RAM PID: 2358
Raspberry Pi NoIR Camera Board – Infrared-sensitive Camera PID: 1567
SD/MicroSD Memory Card (4 GB SDHC) PID: 102 bigger
Super-bright 5mm IR LED (25 pack) – 940nm PID: 388
Miniature WiFi (802.11b/g/n) Module: For Raspberry Pi and more PID: 814

$102.75

Chessboard:

Laser engraved acrylic
Sides
Chess pieces

$30

Golan:

Screen
Keyboard
Projector + IR filter?
HDMI cable
Money??

Receive: $150

Software:

See Research.

Rasbian Wheezy (Linux)
OpenFrameworks
Cross-compiling
Hell

Research:

OpenFrameworks on Raspberry PI:
home :                  http://openframeworks.cc/setup/raspberrypi/
setup:                   http://www.openframeworks.cc/setup/raspberrypi/Raspberry-Pi-Getting-Started.html
workflow:           http://openframeworks.cc/setup/raspberrypi/Raspberry-Pi-Workflow-Overview.html
cross-compiler: http://www.openframeworks.cc/setup/raspberrypi/Raspberry-Pi-Cross-compiling-guide.html
distcc:                   http://www.openframeworks.cc/setup/raspberrypi/Raspberry-Pi-DISTCC-guide.html
samba:                 http://www.openframeworks.cc/setup/raspberrypi/Raspberry-Pi-SMB.html
Setup:                   https://www.creativeapplications.net/tutorials/how-to-use-openframeworks-on-the-raspberrypi-tutorial/
cross-compiler:                 http://visualgdb.com/tutorials/raspberry/crosscompiler/

Cryptography:
History:                http://en.wikipedia.org/wiki/History_of_cryptography
Scytale:                http://en.wikipedia.org/wiki/Scytale
Vigenere:            http://en.wikipedia.org/wiki/Vigen%C3%A8re_cipher
Chess:                   http://en.wikipedia.org/wiki/Grille_%28cryptography%29


ypag

23 Mar 2015

In short: A phone app to create portals in water puddles to show speculated futures by augmenting reflections.

Inspiration: My obsession with water puddles, portals, parallel universes, optical illusions and water reflections.

Presentation is here

Description:
Users will be asked to find a ‘perfect water puddle’ (with clear sky reflection in it). When they look at this perfect puddle from their phone application, a portal to another world will be created. The reflection in the puddle will replaced by reflection from another world. This world will not merely be a figment of fiction but an speculated future which might become reality in near future. By looking at this speculated reflection, users can reflect on what their world might become.

Technology:

1. Ask the user to tap on the puddle of their interest. Detect the pixels of the puddle against the road/background.

2. Calculate the perspective from which the user is viewing the puddle.

3. Warp the futuristic reflection to the puddle depending on the angle/perspective of the phone Vs ground plane.

Platform: I am planning to use openFrameworks.

Useful links:
ofxCV
ofxiPhone

dantasse

23 Mar 2015

Tweet summary: Find out how much of your neighborhood is Place, and how much is Dead Space. (or Non-Place.)

Jane Jacobs talks about density as a key feature of lively neighborhoods. It makes them fun to walk around, which makes them accessible, democratic, interesting, and affordable. Duany, Plater-Zyberk, and Speck write about how you need at least 15 dwellings per acre to support buses every 10 minutes. Downtown Cleveland is hard to get around, while Pittsburgh does all right. Density is important. But how do we measure density?

  • people per acre: nope, maximizing people-per-acre gets us the Kowloon Walled City.
  • dwellings per acre: getting better; I examined that in a previous project. But we can’t really feel “100 dwellings per acre” or “30 dwellings per acre.” What do those mean? And what about areas like downtown Manhattan that have few residents, but bustle with life?
  • percent useful space: That’d be nice, but how do we do it?

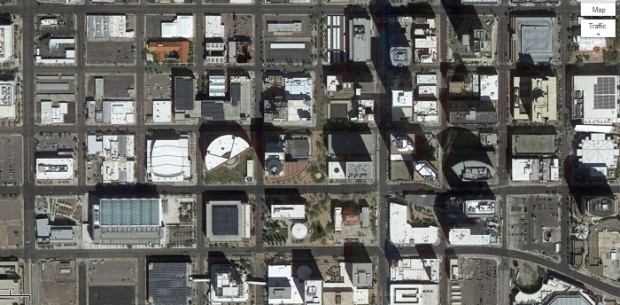
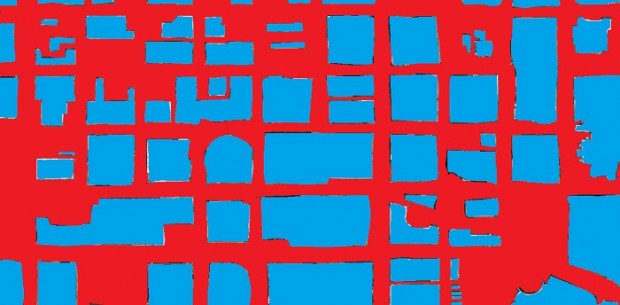
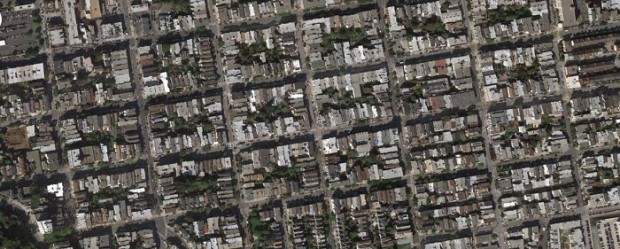
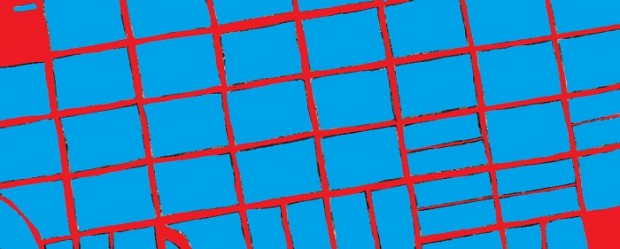
Andrew Price gives it a try. Hard to tell much about this slice of Phoenix from the air:download (3)But if you look at what’s actually here, you’ve really got about 50% dead space, including roads, parking lots, and other places that are not really made for humans. He’s colored it all red (non-place) and blue (place):download (4)This would not be a ton of fun to walk around. And looking at it in this light helps us distill a vision of how cities could be. Less of that, more of this (San Francisco):

downloaddownload (1)


But the problem is that Price has to draw each of these things by hand. I feel like this could be auto-generated, which leads to what I’ll actually make: a web app. You go to the site, put in your location, and it shows you both the satellite map and this place/non-place layer. Hopefully you can draw a polygon (say, of your neighborhood) and it’ll tell you how much is place or non-place inside that.

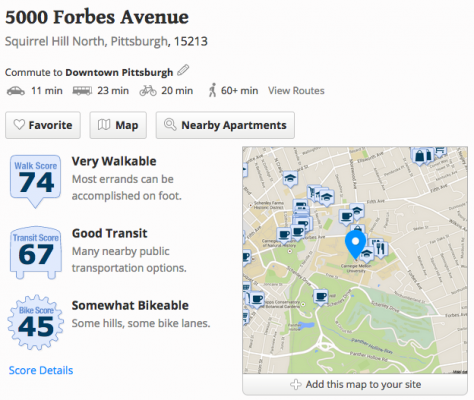
So what? It’s just a number, right? Well, so is Walkscore:

Screen Shot 2015-03-23 at 7.24.04 PM

and yet, that’s become a valuable tool for deciding where to live, where to put an office, and maybe even where to put urban improvements. It would help our discourse be more concise if you could say “the problem with your plan for the new development is that it’d be 82% Non-Place.”

How to do it? Two main data sources:

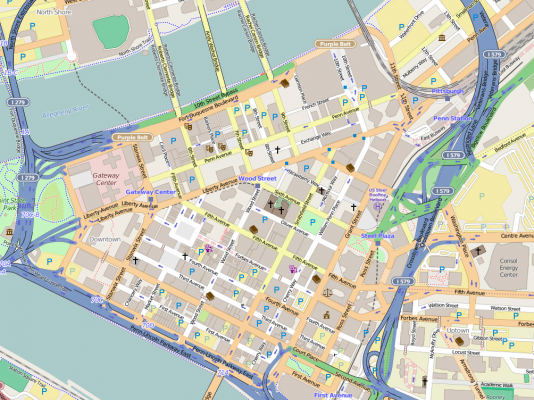
  1. building data from OpenStreetMap. OSM has some building data – not a ton, but it works if you’re looking downtown.Screen Shot 2015-03-23 at 7.59.41 PM
  2. Satellite imagery, from Landsat 8. (More info)  Contains not only satellite photos, but also infrared and other invisible data bands. As a result, we can get data about surface heat and other properties that may tell us more about what each place actually is.