A customizable #OpenSCAD Cat o’ Nine Tails by @brttaylor
I created customizable renderings of cat o’ nine tails. The number of chains, their lengths and curvature are all customizable. As are the chain link parameters. This is less useful that I first thought it would be, as customizable chain links are pretty pointless. Basically you just change the scale and that can be done with zooming. Otherwise you can warp the dimensions, but that ends up looking not so great either.
The biggest challenge with this project was getting the chain links to properly connect along a curve. Iterating through the rotations along the chain was not as easy as I hoped. I like that my program broke down into nice discrete pieces, though. Outside of setting the parameters, the main function is less than 10 lines long.
Link to Thingiverse
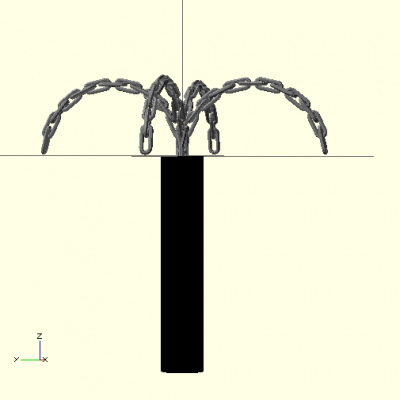
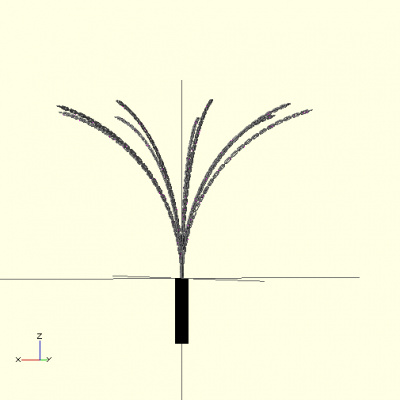
A simple, symmetric cat o’ four tails
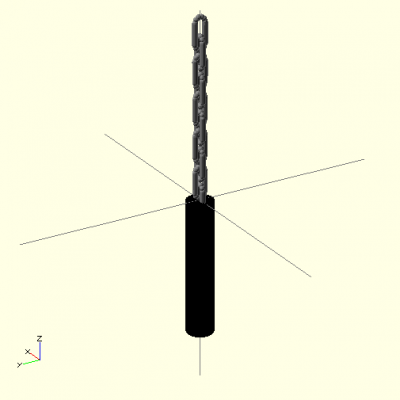
A single chain with thicker links
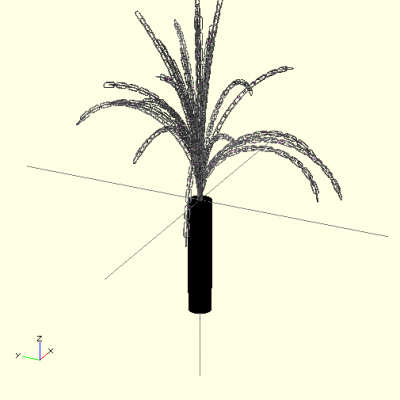
Randomly generated. Chain number, lengths and curvatures were randomized.
Code is here
1 2 3 4 5 6 7 8 9 10 11 12 13 14 15 16 17 18 19 20 21 22 23 24 25 26 27 28 29 30 31 32 33 34 35 36 37 38 39 40 41 42 43 44 45 46 47 48 49 50 51 52 53 54 55 56 57 58 59 60 61 62 63 64 65 66 67 68 69 70 71 72 73 74 75 76 77 78 79 80 81 82 83 84 85 86 87 88 89 90 91 92 93 94 95 96 97 98 99 100 101 102 103 104 105 106 107 108 109 110 111 112 113 114 115 116 117 118 119 120 121 122 123 124 125 126 127 128 129 130 131 132 133 134 135 136 137 138 139 140 141 142 143 144 145 146 147 148 149 150 151 152 153 154 155 156 157 158 159 | pi = 3.145926535; //General Params chains = 9; curvature = 76; //Chain Params links = 50; //Link Parameters smooth = 10; //10 thickness = 2; //2 height = 16; //16 width = 8; //8 //Handle color([0,0,0]) translate([0,0,-200]) cylinder(200,20,20); for ( i=[1 : chains]){ rotate(i*360/chains,[0,0,1]) chain(links,curvature); } /* for (i = [1 : chains]){ rotate(rands(0,360,1)[0],[0,0,1]) chain(rands(20,30,1)[0],rands(0,180,1)[0]); } */ module chain(links,curvature){ length = (links + 1) * ((height + width)/2 + thickness); radius = length / d2r(curvature); lc = curvature/links; link(smooth,thickness,height,width); if(links > 1){ for(i = [1 : links-1]){ if( curvature > 0){ translate([radius *(1 - cos( i * lc)),0, radius * sin ( i * lc)]) rotate(lc*i,[0,1,0]) if ( i%2 == 1) { rotate(90*i,[0,0,1]) link(smooth,thickness,height,width); } else{ link(smooth,thickness,height,width); } }else{ translate([0,0,i*(height/2 + width/2 + thickness)]) if ( i%2 == 1) { rotate(90*i,[0,0,1]) link(smooth,thickness,height,width); } else{ link(smooth,thickness,height,width); } } } } } module link(smooth,thickness,height,width){ color("Gray"){ translate([-width/2, 0, -height/2]){ cylinder(height,thickness,thickness); translate([width,0,0]){ cylinder(height,thickness,thickness); } for( i = [0 : smooth]) { translate([(width/2) - (width/2) * cos(i*180/smooth), 0, -(width/2) * sin(i*180/smooth)]) sphere(thickness); } for( i = [0 : smooth]) { translate([(width/2) - (width/2) * cos(i*180/smooth), 0, height + (width/2) * sin(i*180/smooth)]) sphere(thickness); } } } } function d2r(theta) = theta*pi/180; |
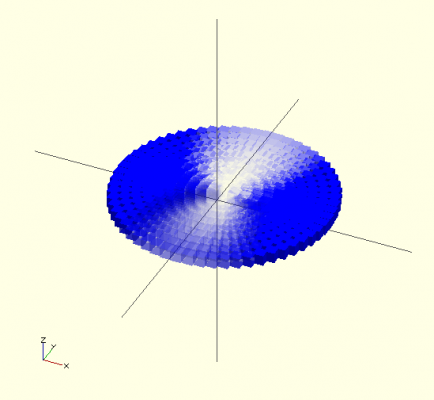
My first idea was to try and generate images of Hyrdrogen wave functions. The states are controlled by 3 parameters and create interesting distributions. I played around with trying to represent the wave density below. However, OpenSCAD does not really play nicely with complicated math (variables in for loops are problems, you can’t really return variables from functions). Without that, there was really no way to generate the distribution from the parameters. Even if it had, I’m not sure that I had a good way to do the visualization. The density plot below was made by discrete spheres with varied alpha values. Mapping constant probability densities probably would have suited OpenSCAD better, but it still would have required the math.
