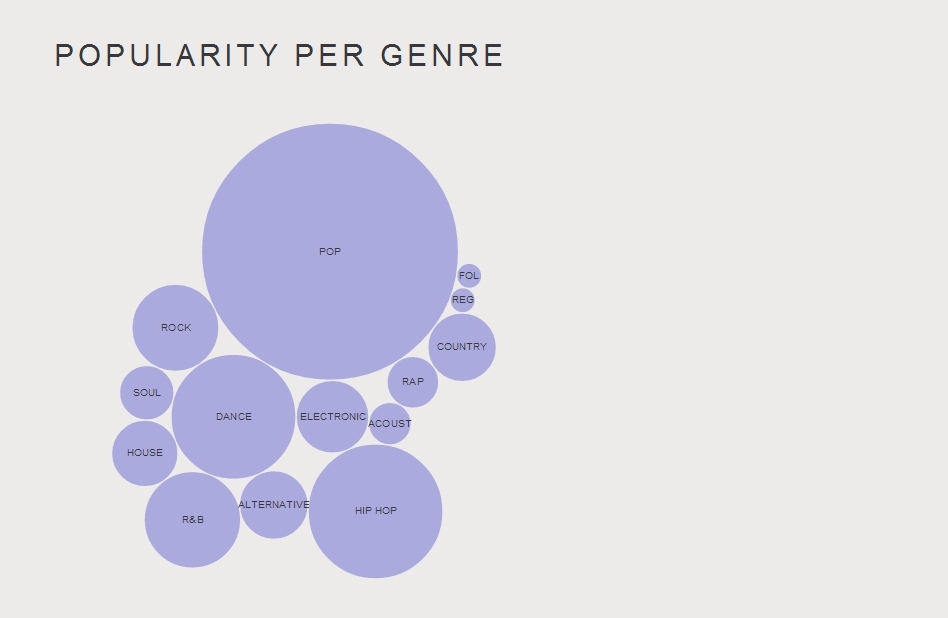
Description Using Kimono, I gathered songs that made it to the top 100 annual chart during the past 5 years. I extracted additional information – such as gender of the artist(s) and song lyrics – using multiple APIs, including last.fm and lyricsnmusic. I filtered and cleaned all this data, and pushed it to Google spreadsheets. I extracted the data using sheetsee.js and visualized it using four examples from D3.js. Some visualizations were easy to implement, such as the bubble chart, while others more challenging. This assignment was exciting, informative and an absolute delight. It made me realize how powerful Google Spreadsheets API is. I feel like there is almost no need for a back-end anymore, and this is simply wonderful.
Daily Archives: 11 Feb 2014
Wanfang Diao
11 Feb 2014
This is a data visualization for 2008 Olympic Game gold medals. I scraped data form wikipedia. I am a beginner of JavaScript. I fork a example of d3, and add labels of country name on each bubble. I will continue study about JavaScript to figure out how to make it more interactive and add more years of Olympics.
Kevyn McPhail
11 Feb 2014
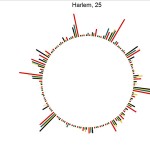
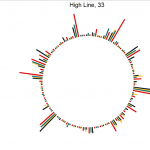
Here is my D3 visualization of the activity of Curbed:NY. A little background on curbed, the website shows the different architectural and real estate development and sales in a region. So what I did was use create a custom scraper that gets the amount of times that neighborhood is mentioned. Finally, I graphed that data to see how different neighborhoods compare to one another. One interesting find is that I did not expect Harlem to have a lot of activity. I did some more reading to see that the district is beginning to undergo a period of gentrification.
I hate javascript, its an annoyingly funky language that’s not very explicit on what you need and when you need it. I had a lot of issues with types of variables being passed/not passed through some functions (callbacks) and had to jerry-rig the code quite a bit…but I got the hang of it around 2am the night before this was due and above is the result of my dance with javascript!
Sama Kanbour
11 Feb 2014
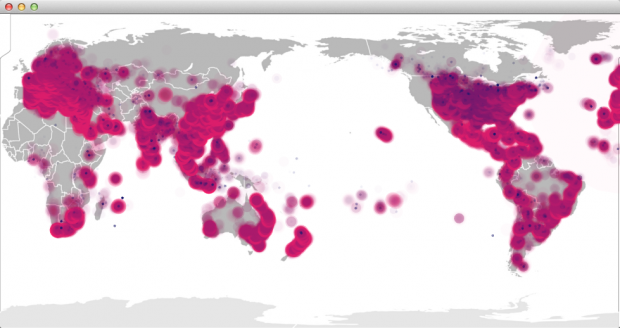
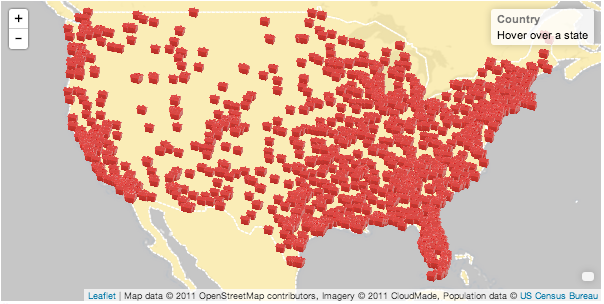
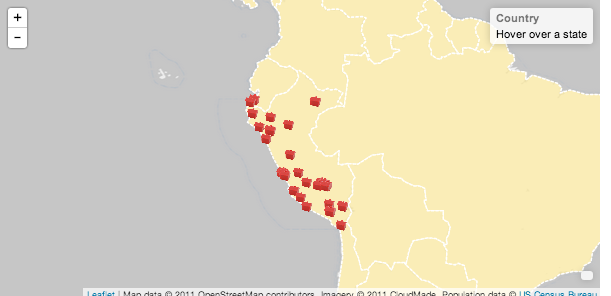
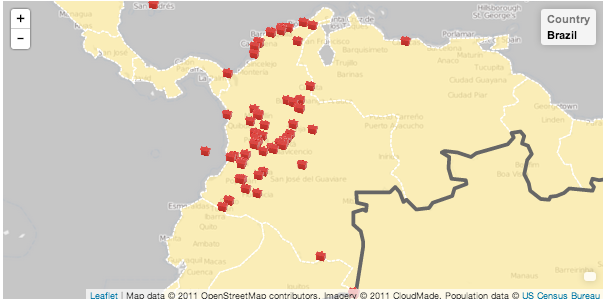
Description for this assignment, I used the Google Map API to visualize the data points. This API comes with a zoom feature and other interesting features that I later discovered while reading the documentation. Given the large amount of data, the rendered graph wasn’t readable at first, therefore I had to implement the sort, filter and search features to enhance user experience. I have made several design choices to group the hotels by proximity. In particular, I used markerclusterer.js which renders the map in a visually appealing and interactive way.
Early stages of the Interactive Map assignment
Wanfang Diao
11 Feb 2014
I used ofCsv addon. It takes me a lot of time to figure out I have to clear the “NULL” to overcome the errors in openFramework. What’s more, this project also force me to pick up my middle school geography knowledge to map points to the map picture. I visualize the stars and the position of hotels, if you put your , mouse on it, you will get the latlong.
screen capture video:
JoelSimon 2-3 Scrapping
For this I scrapped 70GB of wikipedia page views for all of June 2013. This data is all available on public amazon s3 buckets with the views for every page per hour. I use amazon map reduce to reduce this to only pages with over 100k views and for every day what the views were.
Here all pages over 500k views can be seen and clicking on any one shows a graph of the view over the month.
Some interesting trends were:
Yahoo jumped from about nothing to 450k/day when they announced the purchase of tumblr.
Tv shows peaked every 7 days.
People search for cat anatomt…
Yahoo when they bought tumblr..
Hannibal TV show
What a mapReduce program looks like..
#!/usr/bin/python
from __future__ import print_function
import fileinput
import sys
import os
badTitles =  ["Media","Special","Talk","User","User_talk","Project","Project_talk","File","File_talk","MediaWiki","MediaWiki_talk","Template","Template_talk","Help","Help_talk","Category","Category_talk","Portal","Wikipedia","Wikipedia_talk"]

badExtns = ["jpg", "gif", "png", "JPG", "GIF", "PNG", "txt", "ico"]
badNames = ["404_error/","Main_Page","Hypertext_Transfer_Protocol","Favicon.ico","Search"]
#arr = []
#count = 0
#fullName = 'pagecounts-20130601-000000'#os.environ["map_input_file"]
fullName = os.environ["map_input_file"]
fname = fullName.split('/')
date = fname[-1].split('-')[1]

def process(line):
#	global count
        L = line.split(" ")
#	count += int(L[2])
	if not line.startswith("en "):
		return
	L = [L[1], int(L[2])]
	#count += L[1]
	#if(L['name'] != "en"):
	#	return
	for i in xrange(len(badTitles)):
		if(L[0].startswith(badTitles[i])):
			return
	if ord(L[0][0])>96 and ord(L[0][0])<123:
		return

	for j in xrange(len(badExtns)):
                if(L[0].endswith(badExtns[j])):
                        return

 	for k in xrange(len(badNames)):
                if L[0] == badNames[k]:
                        return

	#dateArr = [0]*30
	#dateArr[int(date[-2:])]= L[1]
	print (L[0]+"\t"+date[-2:]+"\t"+str(L[1]))
	return
	#print L['title']+"\t"+L['numAccess']

#total = 0
for line in sys.stdin:
	line = line.strip()
	process(line)
#	total += 1

#f = open ("/home/ubuntu/output.txt", 'w')
#arr = sorted(arr, key = lambda x : x[1])
#print ("sorted", total, count, len(arr))
#for z in xrange(len(arr)) :
#	string = arr[z][0]+"\t"+str(arr[z][1])+"\n"
#	f.write(string)
	#print(string, file = "/home/ubuntu/output.txt")
#f.close()
#print ("Written to file.")
#!/usr/bin/python

import sys

last_key = None
running_total = 0
viewsPerDay = [0] * 30
threshold = 100000
for input_line in sys.stdin:
	input_line = input_line.strip()
	input_line = input_line.split('\t')
	#print input_line
	if len(input_line) != 3:
		break
	articleName = input_line[0]
	date = int(input_line[1]) # 1 - 30 inclusive
	viewsThatDay = int(input_line[2])

	if last_key == articleName:
		running_total += viewsThatDay
		viewsPerDay[date-1] += viewsThatDay
	else:
		if last_key and running_total > threshold:
			print(str(running_total)+'\t'+last_key+'\t'+str(viewsPerDay))
		running_total = viewsThatDay
		last_key = articleName
		viewsPerDay = [0] * 30
		viewsPerDay[date-1] += viewsThatDay
if last_key == articleName:
	print(str(running_total)+'\t'+articleName+'\t'+str(viewsPerDay))
Kevyn McPhail
11 Feb 2014
The goal for the Dual Hello project was simple: get two different addons in openFrameworks to compile together. Simple and Straight forward, or so I thought. The app i ended up creating changes gravity based on the expression of your face. However, for some reason the objects do not perfectly collide…but I’ll fix that… The hardest part for this project was actually getting the addons to work by themselves. I knew once I got that down pat I would be good to go. What made getting the apps to work hard was pretty much my lack of C++ knowledge in trying to get everything pointing at the correct objects. After I got the apps to work after switching editors and installing and re-installing, I though the app should be a fun interaction with one’s body. So I used the face tracker addon’s expression tracker to save expressions and depending on which one you chose, it move the shapes every which way.0
Kevyn McPhail
11 Feb 2014
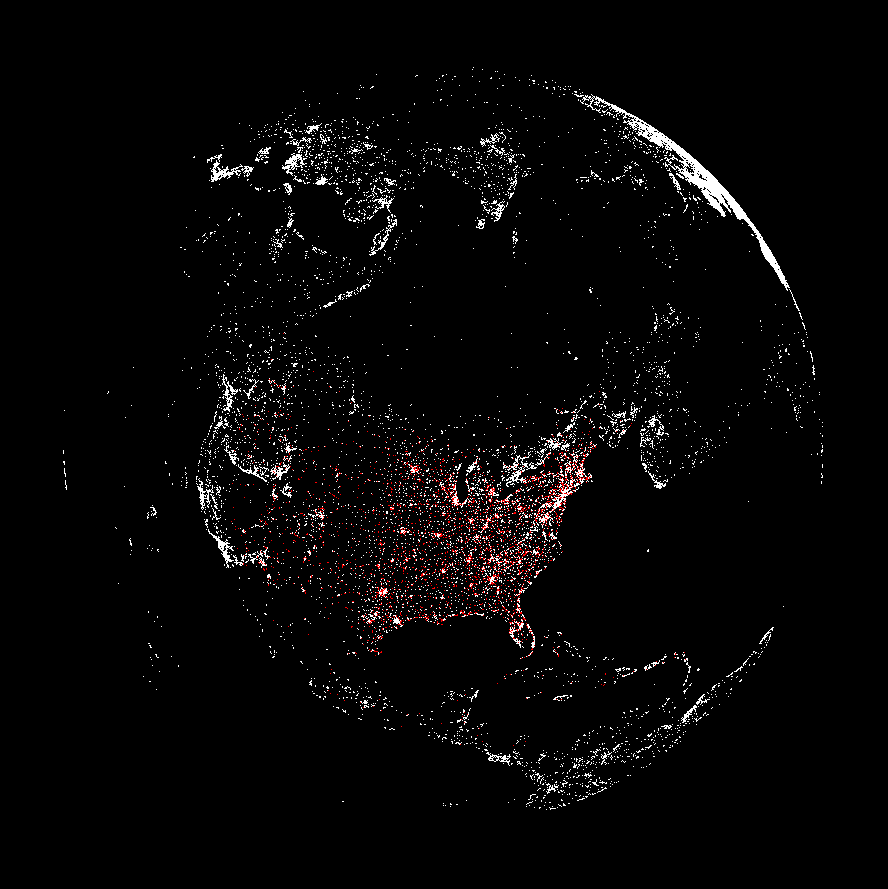
In this project, the goal was to map 500,000 data point, each being a hotel in the world. I knew right off the bat that I was going to have to deal with efficiency with plotting the points, however I wasn’t really sure what or how to plot them. So I went with my instinct and did a little sketch in processing. This helped a lot. It helped me test a the different methods of plotting the points. I ultimately chose to plot a globe and the part that surprised me the most was how the hotels give you rough outlines of countries and continents. I then moved from processing to C++ to gain a little bit of speed with parsing. From there I added the interaction of choosing how far you want to travel, what rating of hotel you want, and your max price. Then plotted in red, the hotels that meet your criteria. The most challenging part of this project was trying to figure out how C++ runs through your code. Initially I was having problems with the interaction where functions were called when variables were called. which was perplexing but I figured out how to make the interaction work. It was a great project!
Haris Usmani
11 Feb 2014
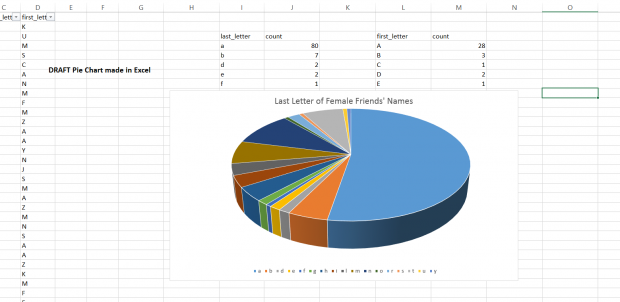
Question I investigated: How many of my female friends’ name ends with the letter ‘a’?
I remember sometime in my undergrad, while working on an assignment late night with a couple of friends, we asked each other the question: What’s the easiest/quickest query to filter female names from a list of mixed first names? I blurted out, just see the names that end in ‘a’- this was an observation I made some while back. Everybody thought about it for while (hmmm?) and nodded- So for this assignment, I wanted to test it quantitatively.
I used the Facebook API through an online console called APIGEE to get my friend list details. I was primarily interested in first names and gender. The APIGEE gave me a JSON file with all my friends’ data in it- I converted it to CSV and used Excel to apply the queries and group the data by a simple pivot table. I saved this data to a Google Doc Sheet.
Workflow:
Facebook API -> APIGEE (https://apigee.com) -> JSON to CVS (by http://jsfiddle.net/sturtevant/vUnF9/) -> Excel (Apply Queries, Consolidate Data by Pivot Tables) -> Sheetsee
A problem I faced was that Sheetsee’s chart example was so longer available. I had got everything loaded till the Google Doc. Just needed to troubleshoot and get the Sheetsee Code running.
Meanwhile, I used D3 to make the following Pie-Chart choosing from the large list of D3 examples available at http://christopheviau.com/d3list/

