Bueno

06 Feb 2013

First up, The Art of Reproduction by the duo Fernanda Viégas and Martin Wattenberg, a project done in 2011. This project might be considered a unique curatorial perspective – the internet as a museum.

Viégas and Wattenberg gathered up as many digital copies of images of a select few famous artworks they could. Then, they coded up a program that would construct a mosaic out of components of each reproduction, forming a new whole imitative of the original painting/photograph. The huge variances in color are astounding. Even dimensions and proportions do not remain constant, thanks to small croppings of the images here and there. The resulting visualization is a concise observation of the innaccuracies of (digital) artistic reproduction.

http://hint.fm/projects/reproduction/


Next is a visualization that I feel more ambivalent about. Note that with the current goings on in the US I am quite invested in the topics of gun violence and gun legislation. I was even considering trying to tackle them for a while as part of this project. That said, Perioscopic’s U.S. Gun Murders in 2010 seems to go against the normal grain of infovis somewhat.

The graph consists of curved lines over an axis representing time. Each line is a person’s life. At some point the lines switch from yellow-colored to gray-colored, representing the point in their life where they were killed by someone with a gun. The rest of the trajectory represents the life they could have lived. Now, for me the problem is this last bit, the blatant speculation on the part of Perioscopic. While the graph is less visually striking without such a feature, it seems a tad dishonest or ill-considered. Should infovis consist solely of hard facts? I always thought so.

http://infosthetics.com/archives/2013/02/us_gun_murders_in_2010_an_alternative_view.html

This last one is really cool, though it isn’t strictly infovis in that it references no concrete data set. It does, however, help us to visualize the ever present but always invisible electomagnectic fields, radio waves, etc. They physically affect our world, never seen, never heard, but integrated into our surrounding space.

The light sculptures that Anthony Dunne and Fiona Raby created in this series, Immaterials, have no real tangibility, of course. But they are beautiful, and certainly a good use of an old technque.

http://www.onformative.com/work/immaterials/

Sam

06 Feb 2013

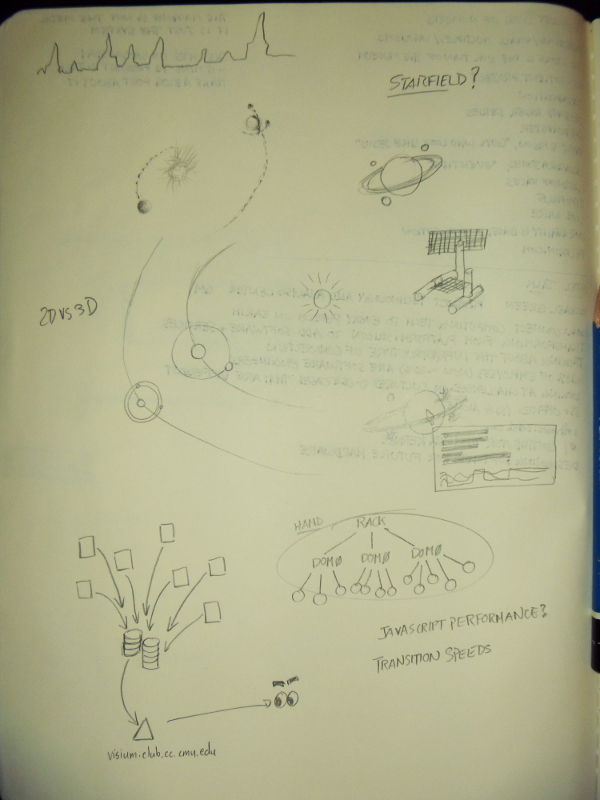
When I talk about Computer Club, I often introduce the club as having racks of servers squirreled away in Cyert B-level, happily grinding away at running a variety of services. But there hasn’t been a good way to communicate to people the scale and activity of our systems. I plan to construct a real-time visualization of the status of the Computer Club machine room, making it available directly from our webservers so that anyone can see what’s going on in real time.

I plan to collect data from as many of our servers as possible and aggregate it in a database to drive a web-based infographic. I was inspired by the Planetary project by Bloom, which visualizes the user’s music collection as solar systems in a galaxy, and saw that Computer Club’s infrastructure has a similar three-tiered structure which makes it ideal for such a visualization.

vis_sketch

I anticipate the challenges in this project will be in incorporating the “smaller” data, such as active users and processes, into the visualization without either introducing clutter or making them invisible, and ensuring that the data maps in an intelligible way.

Sam

06 Feb 2013

Embers (The Digital Artists)

Embers isn’t a particularly impressive demo to look at. What is impressive is this:

6370202430202f746d702f7a3b287365642031642024307c7a6361740a1f
8b0810293e245f3b245f0a290a003af7ebed3f7606086002621620be02e5
b3027100103302b1000341c00863bcc3a3c08280fe440e08871d49820f88
6580980788f54b8b8bf4733293f4532a7352a06206402c816698737e727e
a25e5a51626e6a797e51b63e98cfd0fc46a3f9c9871dcc4005bb415edaff
0d684f1410c4860631e72a74fbca3ce269a855f329fdc41c6aa21d6af388
a3f31a73a90e73a84ac34bced2bb13631312988d66f2af67326273b3122b
fd66ccae5a5f5fcf90d81bc453fa9439eb4fa776626f34cb7aff47d70ddf
32b127b4ff75075b9390f05fb8d345c52311240be5a82073421213418ab1
985cba37713d314ecbced5e1617c45ba034be765e8005d1811181416fe5f
203e2e2a32c30095bfff1c301d743eeb0d63c9304195e9b633fc96618126
66d5f93bc307552c2e8b71df3d06a0218f325cd064c2321cd06c33e86660
c88841159c1e91710de808c3931919686e0d41e577fecb8840d39a1180a6
25018d5f8066c4f30c15342fe9a86468a009d9a8743ecb9040b7bcf37d86
008642c36f86977646b1007d25832ad77c90039b9002314241617759546e
387eb92ba31217d56cc9507a0268b7089a7bde03ddc883e1bb1c5411a039
b76554e2c31bff4f034651b167162310fecffa0f0e9b1434ddf7336c5045
121280267aa08a251e7c279658dc78c00692130fa642b3a4543d90507064
3482d00c4a207a8103a32984669087f22d21f4a87a22d533406848890d01
009ec868c74d1888a2fb29798a3c309ed859e8b26bdc3e54ea17f4adaa2a
b476ac4818538752bad5fe7b8d49916024cebdbae36b2e7de8a643c4193d
0e9a243a2d09ad168446bbfec757bb7c0e219a6fe23b2d054935dbd7c743
d04388beebaf6f9625d397d8b9eca2e5cfdba91182f86a63d420d5c8e909
006f38aa6dd9c4728683bf9710995ff78dda614c3b556c6595669921d767
2afc7560be5bd8885c12e0face899ffe7313a6a48d8074ae37d9ebb9f0e5
96cae7620415edf42b0eecf6334ebb1fd6b89357ef73b89a83ef52dc7620
35b4cf743cba8f24845443a95d21e903da529390e0f4c46e3a1443c94c5b
d1a7dcd3f027427ea667ace9115e4cdbdc059ebe310fc3a52078c9b44ab0
4a66c31b0200b5df601fa24e8e8a49c2e411941e28d8187eef55a3bdf4f6
75bb42960db9f3fe3b36219db1cc8eb5c33d07b8c39d2794a53baf2d1735
00608015619d466941bd3ffc5b4ca2217f824ea576264752109f7e499dbd
aab38e2d936e8a1c4b85b24a60858011b33d9f36936b6e48616a7449be28
6b9e62b499704401ab932f43ae7872864c61206392432c67ae18174b6e51
818c6d8e3f8f8e4969b17ea68e505171997069a65f3e8354948d5ab15436

This is the entire compiled code for Embers. It is only 1020 bytes, and yet the demo manages a soundtrack and variety in the procedurally-generated environments which is rarely seen at this size. Tiny demos are all about unwinding intricate generative scenes from obscenely small amounts of code, and Embers represents an immense step forward in that regard.

Silk (Yuri Vishnevsky and Mat Jarvis)

weavesilk

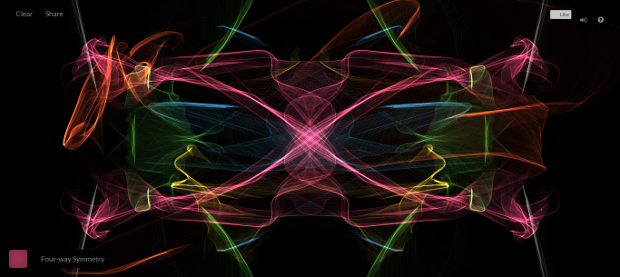
Silk intrigues me because it has taken an extremely simple idea, that of building curves with the user’s mouse, and yet it has been executed in a way that creates a very rich sculptural experience for the user. The fade-off of the colors and basic applications of symmetry present an easily-learned interface and quickly produce undulating surfaces and voids, almost as alien hallways out of science fiction. One part of me yearns for more controls and capabilities in the interface: wider color selections, more complex symmetries, methods of rotation and translation. Yet at the same time, I feel that the project would become lost under those extensions, and that the present, limited interactions are already sufficient to produce intriguing sketches.

ANGELINA project (Michael Cook)

angelina_santa

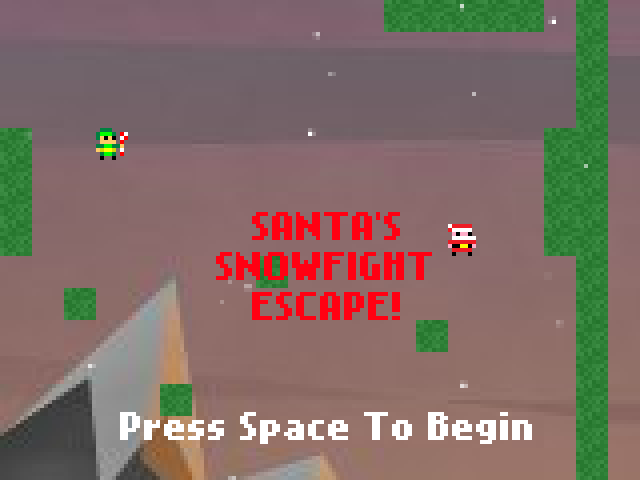
ANGELINA designs games. She is an ongoing project developed by Michael Cook to produce an artificial intelligence which can generate games without any human input. The project began with simplistic collision-based games, and has evolved towards side-scrolling adventures, reminiscent of the original evolution path of human-designed games. ANGELINA, originally dependent on the work of Cook and others to provide many of the underpinnings of her games, now engineers all of the mechanics of the games herself, and is growing to develop even the images and music for games unaided, all while responding to feedback from real-world users of the games. I find this project especially intriguing because computer-invented computer games seem unlikely to experience the cultural shunning that other forms of artificial art have encountered from the existing community of creators, simply because the idea of computers doing fantastic things all on their own is already part of the paradigm.

Michael

06 Feb 2013

Sifteo Cube Gigaviewer

Screen Shot 2013-01-27 at 8.58.07 PM

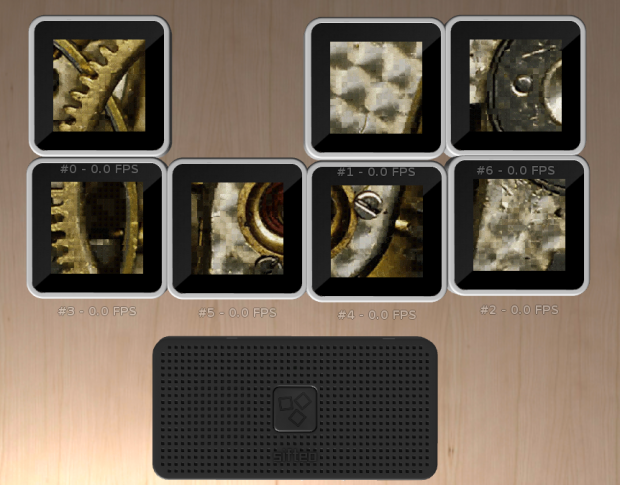
This one’s fairly straightforward.  I really liked what I did with the Sifteo cubes in Project 1, and I’d like to expand it so that the Sifteo cubes can actually be used to explore very high resolution images from a sort of ant-on-a-page perspective.  I’ve already got some code that I’ve made since project 1 that auto-chops images into nice Sifteo-sized bits and then rewrites the LUA file accordingly.  This project would involve packaging all of that up and ideally using the (up and coming) Sifteo USB connection to upload new high-resolution images daily.  This way, the cubes could be an auto-updating installation in a classroom or gallery.

Here are the parts of the project from the image to the cubes (and my classification of each)

1. Get the newest image from a dropbox or git repository (Probably trivial)

2. Write processing script to chop images and autogenerate a LUA script (Pretty much done)

3.  Regularly run the processing script, re-compile, and re-upload to the Sifteo base (Maybe not too hard)

4.  Figure out how to rotate images (Should be easy… need to talk to Sifteo people)

5.  Devise a scheme for managing asset groups better on the limited cube resources (tough but interesting)

6.  Devise a scheme to predict which asset group will be needed next and load in a timely manner to keep the interaction smooth (Hard but very interesting and possibly publishable)


I think there’s some really cool potential here for having to piece together the “big picture” through little windows to understand what you’re looking at.  For example what’s this?

crop


Scroll down!


It’s my arm!

arm2

Patt

06 Feb 2013

I stumbled upon the “My Milk Toof” blog by Inhae Lee a while back. As the name suggested, it is about a story of two little tooth characters, Ickle and Lardee, who keep this blog alive. The characters are made out of polymer coat and painted with acrylic, and there are about five models of each in different expressions. Making each character by hand not only takes a lot of time, but it also sets boundaries and limitations to what the shapes of the characters can look like.

With the two characters in mind, I want to create a tool that can generate characters in various forms, but at the same time still maintain the same fundamental shapes (i.e. tooth). I am hoping to make use of toxiclibs library to create 3d models. I want to also do some digital fabrication to actually see the characters in a tangible form.

Erica

06 Feb 2013

I have a few ideas for the types of data I’d like to work with for my Info Vis project but I’m not sure which would be the most interesting, have relatively accessible information, and/or lend itself to an interesting visualization. A lot of my ideas pertain to Judaism, which has a lot of somewhat complicated laws that might be easier to learn/understand if they could be visualized:
1. Information pertaining to Koshrut (i.e. whether Jews are allowed to eat certain types of food). The types of information I could obtain about Koshrut is pretty diverse; I could gather information about the specific laws and whether these came from the Torah or the Misnah (basically if it is the 5 books of Moses or is from the Rabbis), as well as a more practical focus on what products you can actually buy in a super market, what companies they come from, what level of Koshrut they pertain to, etc.
2. Laws and Customs specifically pertaining to Shabbat (the day of rest from Friday evening to Saturday evening). There are a lot of dos and don’ts when observing Shabbat, as well as different customs that are followed by different types of Jews. Usually these customs are dependent on what part of the world a specific family is from.
3. Prayers – when, where, with who, for what purpose is each prayer supposed to be said – pretty self-explanatory
I am also really interested in the diversity of Jews both in terms of location and in terms of level of practice. Given this,
4. Assimilation of Jews in different countries, or maybe specifically the US – how, when, why Jews began to assimilate, what traditions they continue to follow and which were deemed to extraneous to keep up with, where most assimilation occurred, etc.
5. Different Customs – different Jews around the world have varying customs for different aspects of Judaism, which types of Jews follow what customs, where and why these customs originated, etc.
I have a few other ideas that have nothing to do with Judaism but are just various things that I like/am interested in:
6. Pronunciations of English words and where they are used – different parts of the country pronounce certain words differently and it would be interested to be able to explore this using data vis and possibly audio as well
7. Price is Right Data – I don’t know about the rest of you but I have been watching this show ever since I was little and by now know every game pretty much by heart but I’ve kind of always wondered if you are actually on the show what is the best game to play in terms of having the best chance of winning. I think it would be interested to explore the payoffs of different games using probability models.
8. My iTunes Data – I’ve noticed that my taste in music has changed a lot over the past few years and my iTunes pretty much has a record of this through the play count and the last played data it tracks. It would be interested to see the progress in my own personal music taste by visualizing this (and maybe other) data.
9. Twilight Zone – I love this show and I don’t know specifically what data I would want to scrape regarding this show but there are definitely a lot of different kinds of data that I could scrape so I think there are possibilities.
10. Roller Coaster Data – Ever since I was about 8 I’ve been kind of a roller coaster junkie and I personally rate every one I right even internally or through description to friends or family. It would be cool to extract data about different types of roller coasters to get more of an objective comparison to go along side my subjective one.
11. Harry Potter – I through this one in here just for the hell of it. There are definitely lots of things that could be tracked about the books but I think it would be cool to do some sort of timeline and/or relationship graph of the entire series.
I know this is a lot, sorry for causing anyone who read this post to read so much!

John

06 Feb 2013

I spent a long time considering what to visualize and how to get the data make something compelling. I’m very anti scrape-and-see w/r/t these sorts of projects because (a) I’ve done that before and (b) I think scraping big text files for key terms is misleading and generally not as interesting as a lot of people seem to think.

So while I was ideating (as we designers do) I remembered a funny thing that happened this summer. I was at a hippy parade thing in Seattle (as you do) and I overheard a five-year-old kid ask his father “what’s the worst thing that’s ever happened to you?” which was the funniest and most amazing question for a little kid to ask anyone.

Anyway, that got me thinking. What would it look like to visualize answers to that? How would I aggregate those answers in a meaningful/compelling way? I’m not sure yet, but I’d like to find out.

That’s the first idea.

The other two stem from a similar germ of asking people to make spontaneous decisions and then using those decisions to model something (what, exactly that is, I’m not yet sure).

Idea number two is this: ask people how uncomfortable a series of words makes them and rank them.

Idea three is a universal bracket (a la the NCAA tournament) where we start with 32 sets of binary pairs which are then filtered to 32 winners. Each winner is then randomly paired with another winner then paired down and so on…I’m pretty sure this process might scientifically determine the best thing ever.

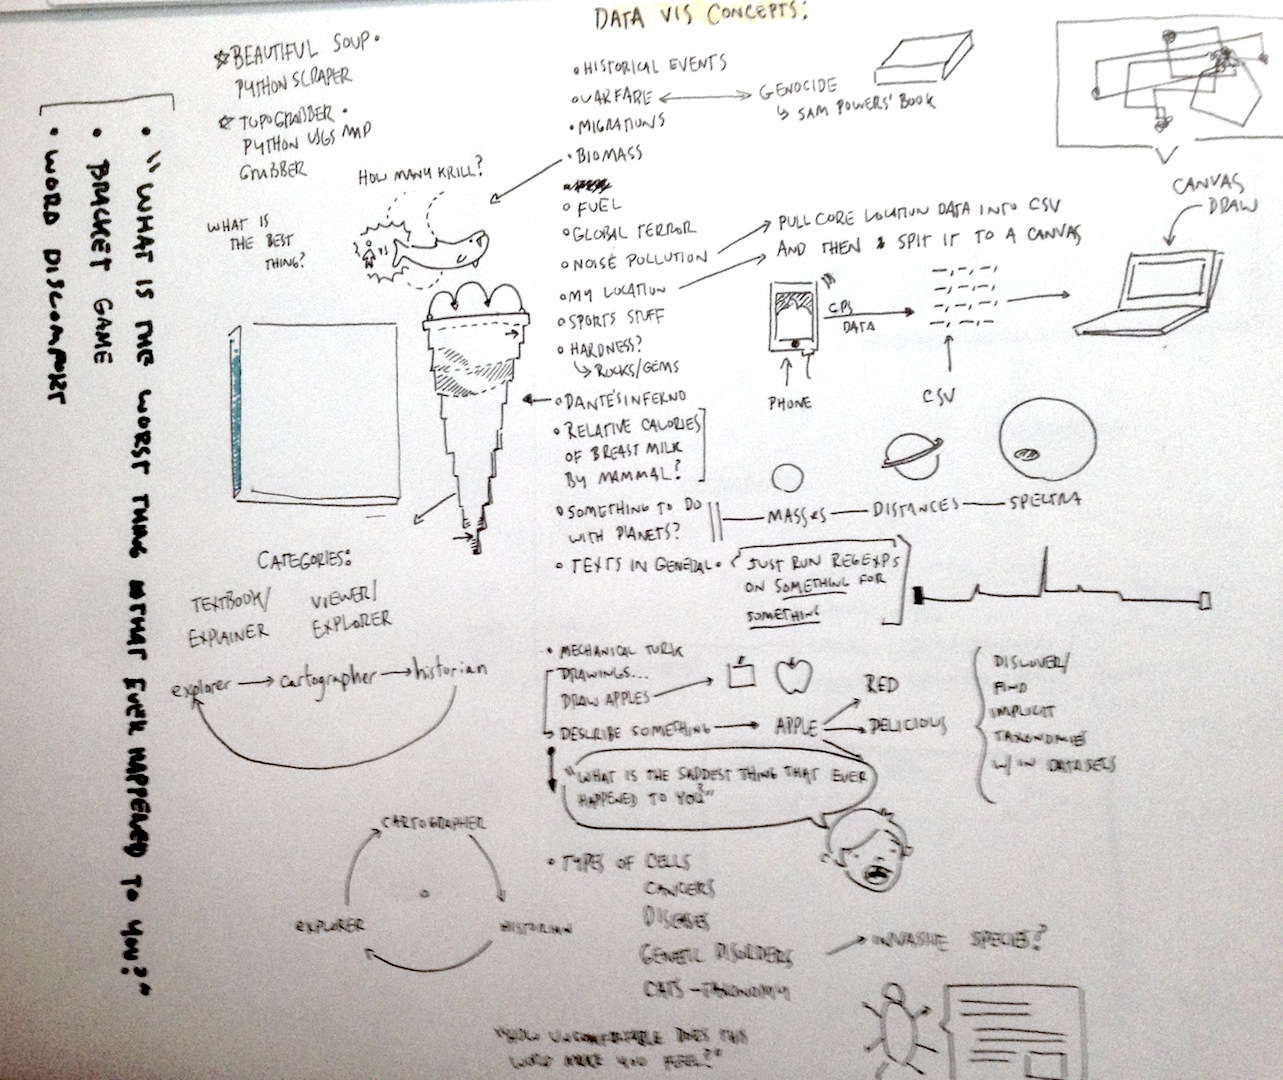
Here’s a photo of my sketchbook (where the magic happened):

IMG_0156

Anna

06 Feb 2013

So! Project 2. ‘Bout that time, eh?

I am completely incapable of deciding between random pipe dreams I have, particularly when it comes to balancing what’s compelling with what I can feasibly do. Here’s a rough list of ideas I’ve had in the last month or so, with elaboration on one or two:

story stealer : a concept based loosely on a story I’ve been writing for a long time. I envision a ‘master consciousness’ looks at two very different narratives and peels away elements, appropriating them and combining them to create its own story with eerie resemblance to both. I’d really like to push this away from the standard, mad-lib-style, mix-and-match algorithms that just seem to lead to disjointed and clearly computer-generated text. In particular, I want to know how well code can analyze a narrative for things like ‘tone’ and ‘voice’ and then dynamically write new paragraphs using those learned elements, even if the topic is entirely different.

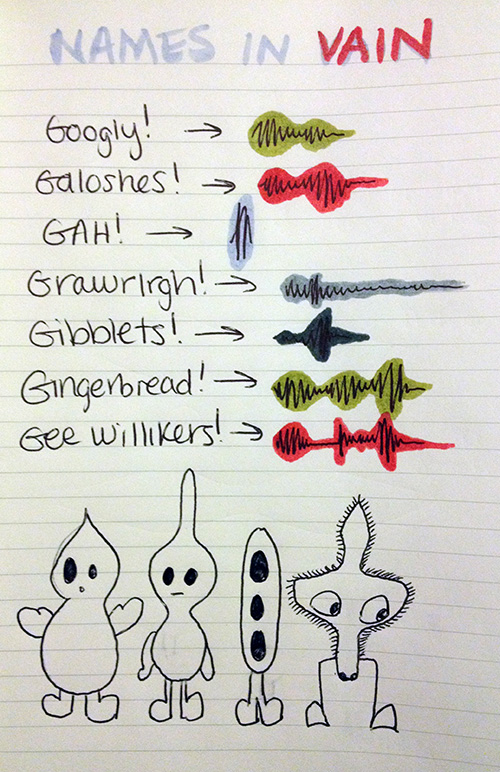
names in vain : also based on a story I wrote. People seem awfully concerned about ‘using God’s name in vain’, and so they tend to say a lot of other ridiculous things instead. Do they think about the consequences? What if, every time somebody yelled a nonsense word as an interjection, it generated a little half-deity… something more than human, but not quite omnipotent? What would they look like? Would the word you said matter? The sketch below bases the little not-gods on the shape of the sounds, but that isn’t the only way their forms could be generated.
AVR2

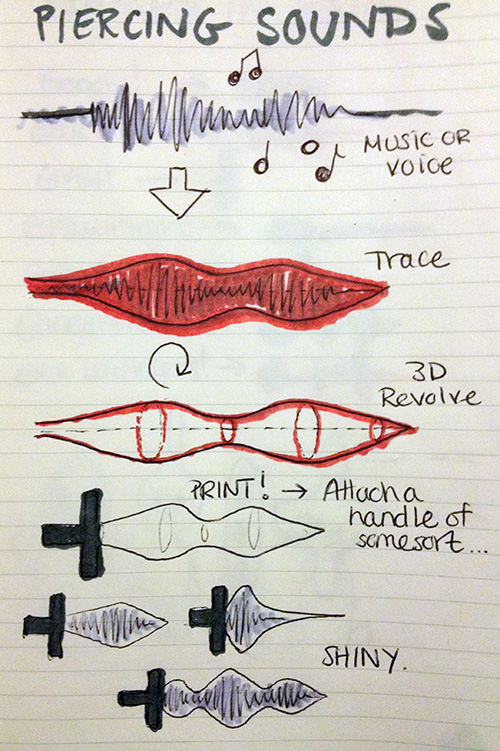
piercing sounds : the last story-inspired idea. Again based on the shapes of sounds. Here, I’m interested in the relationship between energy and matter, and the ability of people to create solid objects using their voices. In the story, sound is wielded largely as a weapon. There’s something elegant about knives as artifacts, and the shapes of sounds lend themselves nicely to creating some interesting blades. Obviously for the purpose of a real-world project this would be done in blunt plastic.
AVR1

two screenwriters out for coffee : a dynamically written screenplay of a conversation between two well known screenwriters/playwrights, where the topic is variable but the responses all sound unmistakably written by said writers. Think Sorkin meets Fuller. Or Shakespeare meets Arthur Miller…Hilarity ensues.
better soccer data viz! : see my looking outwards post 5.
radiocarbon database art installation : I’ve got the data… I’d just need to figure out how to make it look as cool as it is.
when do I take all these medications I’m prescribed, and why? : helpful pharmacology info for real people in real life.

Andy

06 Feb 2013

Hello.

So I mentioned maybe two weeks ago that I wanted to do generative music from the parameters of a video game. At that time Golan suggested to me that I should find an open source game from which I could extract my parameters for generating. Since then I have done hours of scouring. What game would it be? I had an idea which kind of grew out of my Sifteo project that I could take an open source multiplayer game, and have interactions between different characters create different chords, and then the sound could somehow then affect the gameplay. As I continued to think, though, I felt like I should limit myself to a single-player experience in a language with which I was familiar so that I could focus most of my attention on the music and not the game itself.

After much browsing and a really poetic experience that I unfortunately didn’t think fit the project, I think I found my source game.

This isn’t really a game per se, but I think it has an attractive simplicity and mathematical depth that it could produce some really good music and a cool experience. Some parameters I thought of include: number of living particles/dead, location of living particles, number of moving particles, average color difference from frame to frame, survival and birth rules, average solid color block size, triggers for clear and reset, time application has been running, number of user interactions with the program (or an average of this per x seconds), and help me come up with more! The messaging system isn’t built in, but with some oscp5 action I could fairly easily write some signal sending I think.

The receiving program would most likely be Max/MSP, but Pd or Nyquist are alternatives I am considering. I think the next step is to build the generative music part and see what kind of sound I can come up with, and then we begin merging and tweaking the connection of the two.

Michael

06 Feb 2013

Conway’s Game of Life

Game of Life

First published in 1970, Conway’s Game of Life is the prototypical example of cellular automata.  What I find fascinating about this simulation of artificial “life” is the incredible ratio of emergent behaviors to governing rules.  While there are many variations, the original game has only four basic rules, yet these can give rise to machines that translate, reproduce, oscillate, and count, among many other behaviors.  There are plenty of good simulators, both online and offline, though I haven’t played with any of them extensively enough to have a recommendation. Golly seems to have very high praise. Over the past four decades, many initial conditions have been identified which give rise to desired behaviors.  I’m interested to learn if there is a way to essentially run the game in reverse from an end condition or behavior to its simplest origin.  This is difficult, as the game is only deterministic in the forward direction, given that cells and structures can cancel out and leave no trace.


Gaussian Processes (the ML/statistical technique)

Unfortunately I haven’t found any great images that make sense on their own, so instead I’ll recommend this gentle introduction to the topic.

Gaussian processes are a set of statistical techniques from machine learning and robotics that can be used in a variety of ways to make predictions about missing or sparse data.   Rather than explain the details of how this works in a short space, I will try to describe what it can do for us.  If I told you the barometric pressure outside my house, and you knew the pressure outside of yours, we might guess that the pressure at a friend’s house in between ours would be about the average of our two numbers, assuming the distance between houses isn’t all that great and there aren’t any massive environmental discrepancies.  Expanding this, if we had a tight enough mesh of sensors across a much larger area, we can predict the empty spaces fairly well.  We don’t usually have the luxury of uniform information density, though, so this method breaks down easily.  Gaussian processes approach problems like these from a different direction, where the “distances” that we care about actually exist in a feature space containing not just latitude and longitude, but other values that describe that point in physical space.  One particularly notable application is the prediction of soil quality in countries like Honduras where there are areas where direct measurements simply cannot be made.  We can still get indirect information about these areas from satellite images and geographical data, which can tell us things like distance from rivers, altitude, foliage density, etc.  If we have soil quality data in other far away locations with similar characteristics, we can use gaussian processes to make predictions even in areas where we’ve never been.  See this paper for more details.

…So why am I suggesting this is a generative process?  It’s a bit of a stretch, but I would argue that this is a generative method because it can be used with real, known data to create predictions anywhere in the world.  If you still aren’t convinced, consider this:  If I mined the Lord of the Rings books for as many geographical descriptions as I could find, I could use data from the real world to give you my prediction about what plants would most likely grow in the Shire and the pH of the soil in Mordor, along with a numerical confidence for each.  (Or maybe I shouldn’t write blog posts this late at night.)


Minecraft (and other procedurally-generated worlds)

Minecraft

I love Minecraft.  Minecraft is art.  My apologies for yet another Minecraft-related Looking Outwards.  Part of what attracts me to this game the most is that no two worlds are even remotely similar.  The development team has done an amazing job at procedurally generating voxellated terrain, and in recent years terrain generation has expanded to include diverse biomes including deserts, swamps, and tundra (complete with reproducing plants and fauna).  When a player finds a village in the middle of the plains, the houses and structures there are unique to that game and likely will not be generated ever again.  The world is also boundless.  As the player walks in a certain direction, the world continues to generate far beyond the player’s field of view.  (It used to be that walking in a huge circle would result in bizarre discontinuities in the landscape when new land merged with old, but this has been fixed recently.)  In my opinion, the procedural nature of the game is what provides the sense of discovery rarely found in other games.  It can be found to some degree in huge worlds like those in the Elder Scrolls series, but these still fail to feel like true discovery, because the player knows that many others have found the exact same hard-coded locations.  In Minecraft, that scary cave you found is yours and yours alone.