IDEA
My project is about “Jersey numbers”. When I was a middle school student, NBA was so popular in Korea, I was one of the big fans of it. Back then, I noticed that a lot of famous players had numbers such as 23, 32, 33, 34. Maybe it is because the basketball heroes had such those numbers (ex. Kareem Abdul-Jabbar had 33, Magic Johnson had 32 and so on). In this project I wanted to see if there is any pattern of popular jersey numbers according to the specific sports, positions, ages and even salaries. This is the reason why I came up with this idea.
DATA
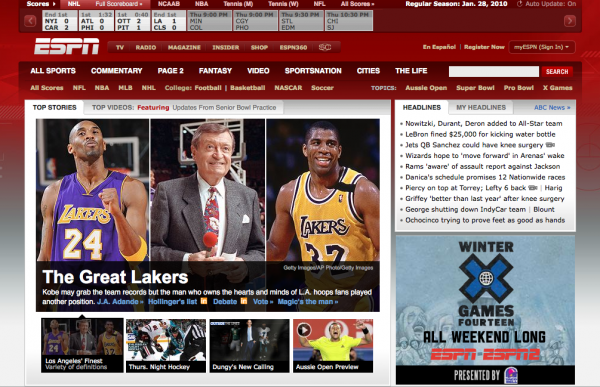
It took a while to make such a huge data sheet. From ESPN website, I copied and paste team by team. Finally I could get almost all the current players information containing their age, position, height, weight, jersey numbers even salary.
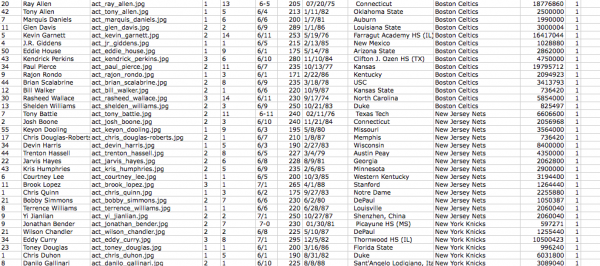
Total 3272 players(383 NBA players + 1261 MLB players + 1628 NFL players). I was able to get all the NBA players pictures but due to the time limitation I decided not to handle the other sports players. This is why you do not see the pictures of MLB and NFL players.
PROCESS
I used Processing to visualize this data. I categorized the data by numbers, sports, positions, experience, salaries, and so on. I tried to apply the color code to make the visualization more clear.
 There are two graphs – one is to see what numbers are popular to use as a one digit (i.e. 34 is counted as 3 and 4) and the other is to see the popular numbers as a whole. Each sports has options to choose so that you can sort and filter the players by positions, experience and salary.
ANALYSES
As I expected, I was able to see a certain patterns for each sports. I want to show some interesting patterns here.
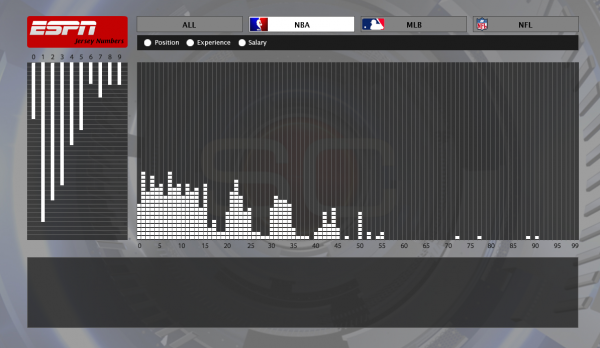
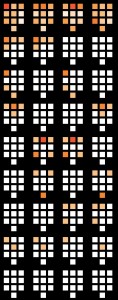
As far as I know, NBA players can wear any number they want unless other players in the team have the number already. But surprisingly, you can see the numbers over 50 are not so popular.
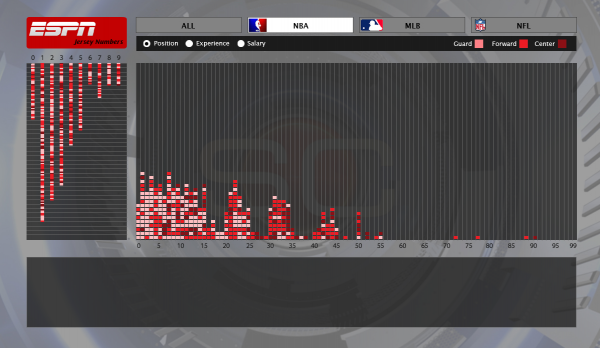
The position wise, you can observe the small size players such guards wear small numbers(light color) and big players such as centers have big numbers – it this coincident?
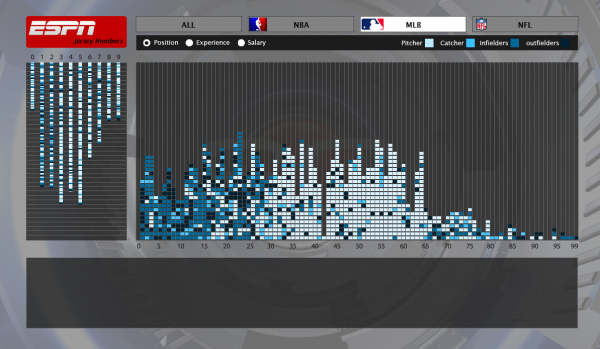
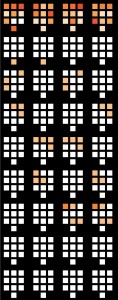
There is a strong pattern that pitchers(light color) have over 25-65 and infielders and outfielders have small numbers (1-25).
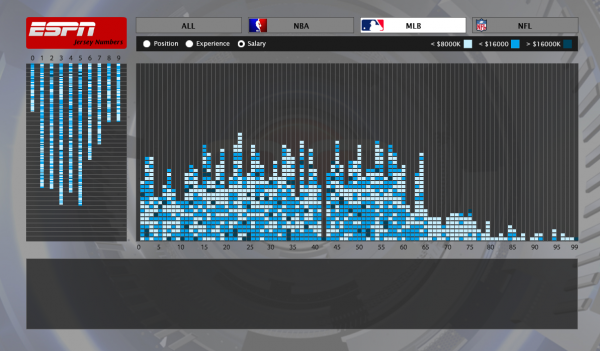 Another interesting thing in MLB is if the player are new or low salary, they mostly wear big numbers. I assume that their numbers here are their temporary numbers in case that other players wear it already so they have to wear leftover numbers. This indicates that big numbers are not very popular in MLB too.
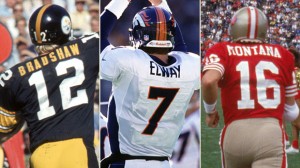
 In NFL I was able to get a very strong pattern. Because NFL players usually wear their numbers by positions you can see this interesting visualization.
CONCLUSION
Accrding to Benford law (the first digit is 1 almost one third of the time, and larger digits occur as the leading digit with lower and lower frequency, to the point where 9 as a first digit occurs less than one time in twenty.), I was not able to get a strong outcome to support it. But I can guess that MLB and NBA players do not tend to have large numbers. And Some article indicate that number “12” is the most popular in NBA but not with my data. FYI, number 1 and 7 was the most popular.
It was so fun to see such patterns but I wish I had more time to play with it more. Maybe I could have compared with more of other sports with more other categories. In HCI perspective, the interface has some things to fix and improve such as cursor shape for mouseover features, Y axis on the graphs should have indicators , maybe could use more effective colors to compare each others. But with the limited time, I am pretty happy with this result.
DOWNLOAD
Source file (16.2M)
Presentation slide (6.5M)


