Michael

06 Mar 2013

How often?

We often hear statistics about how frequently certain events occur.  One child dies from hunger every five seconds.  Someone buys an iPad every 1.5 seconds.  Someone dies from poor indoor air quality every 15 seconds.  A baby is born every quarter second.  These numbers only let us understand these phenomena on a very cerebral level, though.  Even well-designed infographics only engage the user visually.  I would like to make an installation that cycles through a database of these statistics and allows the user to experience each through a combination of touch, light, or sound.  For example, a light could blink with a period of 1.5 seconds to indicate the frantic pace at which the world is buying up iPads while a gentle burst of compressed air to the back of the hand every five seconds reminds the user how often the world lets a child starve to death.  Approximately five children starved in the time it took to read this paragraph.


QR Code Infobombs

People love to scan QR codes, even if they don’t know what they lead to.  I might like to pepper sidewalks with QR codes made with chalk and stencils that lead to a website that presents highly localized and continuously-updated information on smog and air pollution.  If people scan them while walking along a busy road, I hope I can make the presentation compelling enough to make the link between air quality and traffic stick in their minds.


Secret Keeper

I imagine a tiny black cube with a phone number and instructions on the side, to be placed on a pedestal in some public location.  If you text it a secret (and the text checks out in terms of length and variability to weed out messages like “butts butts butts”), it will store it and reply with an anonymized secret that it has heard before and is most similar to yours.  Each secret gets sent to only one other person after a suitable number have accumulated, so you know that when you tell it a secret, only one other person will receive it.  In a sense, it’s a bit like Post Secret, except for the strange sensation that exactly one stranger will know something deeply personal about you. (Also, the cube may emit a faint red glow when it receives the secret, to indicate some link between the physical object and the process).


Patt

06 Mar 2013

I have two ideas for this coming project, both of which has to do with making sound/music.

The first one is to combine the Kinect with abletonLive to create an interactive, real-time performance.

I talked about this video in my LookingOutwards post. I think it’s a great work that combines different tools and brings together different groups of people to create something quite extraordinary. Since I am new to both the Kinect and abletonLive, it will be a chance for me to explore what is possible. For this project, my goal is to learn how to combine the two softwares together to create great music and just something fun to play with.

My second idea is more hands-on. I want to use arduino, conductive materials, and objects you can find around the house such as paper, fabric, plastic, etc..etc.. to make something that can make interesting sound. I have seen tutorials that teach the basics of how this can be done, but I am trying to come up with a new and interesting way to implement it.

http://hlt.media.mit.edu/?p=1372

Kyna

06 Mar 2013

Interactivity Project ->

For this project I’m really hoping to make a game for Android tablets/phones that utilizes the touch screen. I’m not sure if that’s too ambitious for the time we’re given but I feel like it’s an area I’m going to need to explore eventually.

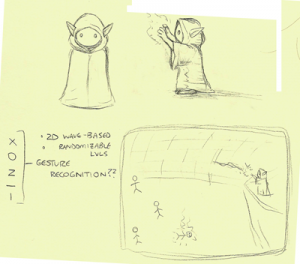
My current idea, which I think is definitely too big for this assignment, is to make a wave-based (think Tower Defense / Plants vs Zombies) game wherein you play as a goblin warlock’s apprentice, and your job is to go clear out an old fort that’s infested with humans. Levels would be different rooms, and the waves would consist of different types of people (knights, knaves, whatever). As a warlock apprentice, you know some spells that you can cast onto the oncoming waves by drawing different symbols.

ugh

I have some other less time-consuming ideas that I might fall back on in the event I can’t get the barebones version of this running by the due date.

SamGruber::Interactive::Sketch

I began thinking about this project with a question: why is code text? Almost all programming must be accomplished by writing out long stretches of symbols into a text box, with the only “graphical” component being (often incomplete) syntax highlighting. Back when all computers could display was text and the primary input device was a keyboard, this was perfectly reasonable.

But now even a high school calculator draws color graphics, and more and more we use phones and tablets which are meant to be touch-driven. And yet, programming remains chained to the clunky old keyboard. Producing programs on a tablet or phone is all but impossible. But there’s no reason it should be. Creating programs should be as easy as drawing a picture.

lambda_graphical

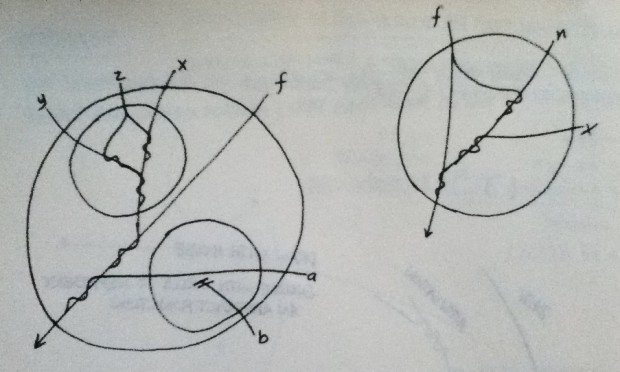
I draw from the computational framework of Lambda Calculus, in which all computation is represented through anonymous function-objects. Naturally, this mode of thinking about programs lends itself to a graphical interpretation.

Lambda Calculus needs only a few metaphors defined. A line charts the passage of a function-object through the space of the program. Helix squiggles denote passing the squiggled function-object to the other function-object. Double bars indicate an object which dead-ends inside of an abstraction. Large circles enclose “Lambda abstractions” which are ways to reference a set of operations as a unit with inputs and an output.

The goal of this project is to develop a drawing-based editor for Lambda Calculus programs that can be expressed in this manner, which automatically converts the user’s sketches into programs.

Erica

06 Mar 2013

I have a couple of ideas that I am trying to decide between for my interactivity project.  I am interested in doing something that is both screen and touch based using either a phone/tablet, Sifteo, the AR toolkit, or Reactivision.  I’m not really sure what I would do with these later two tools, as I was just introduced to them in class on Monday but I’m keeping them in mind.

My first idea is to continue the Sifteo project that Caroline, Bueno and I worked on for project 1.  I think that we had a really neat idea and I would like to find a way to optimize the clock to alleviate the memory issues we were having as well as create an interface that would allow users to design their own “puzzles” for turning off the alarm clock.

Another idea I have to to use As-Rigid-As-Possible Shape Manipulation (which makes it possible to manipulate and deform 2d shapes without using a skeleton) to create a tool for real-time, interactive story-telling.  I plan to implement this algorithm in C++ for my final project for Technical Animation, and I thought that I could extend upon this to let users draw the characters to be manipulated on a tablet, then, by connecting to a monitor or a projector, tell stories by manipulating the characters.  I see two possible applications of this: 1) as a story-telling tool to create a sort of digital puppetry, and 2) as more of an interactive exhibit where visitors could add to the story by either creating new characters or manipulating the characters that are already there.  I’d also be interested to hear other suggestions of applications of this.

I’m also really interested in the idea of educational software.  For my BCSA capstone project I’m working on an educational game and I really appreciated the iPad app we saw Monday that counts your fingers.  I would like to maybe apply the Shape Manipulation I discussed above to an educational context but I don’t have one definitely in mind yet, so I’d also like to hear ideas of such applications or ideas of interactive educational software in general.


Caroline

04 Mar 2013

FFT = Fast Fourier transform

Engineering Terminology for artists

Will be focussing on continuous digital data: 1D sensors and 2D signals (images)

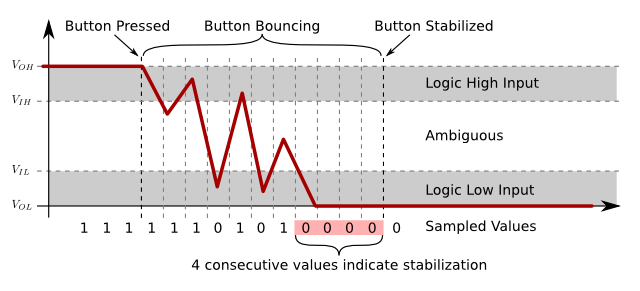
Even buttons have noise. Media artists must deal with noise:

url


Signals:

amplitude, frequency, period

Timbre: the shape of the wave (ex: square, ragged, curved)

Phase: phase must have two waves in relation to each other. They can cancel subtract or add to each other.

Pulse Width Modulations: duty cycle is the amount of time something is on

Spatial Frequency: visual signals have it all too ( amplitude, frequency, period and orientation)

different spatial frequencies convey different things about about an images:

high = detail, low = blur

Digital Signals:2 numbers characterize the sampling resolution:

Bit Depth

Sampling Rate

Nyquist Rate & Aliasing: nyquist rate is 1/2 the sampling rate. Any frequency higher than  two times the sampling rate will be aliased ( distorted and represented as a lower frequency)

line fitting: least squares line fitting. opencv

Forier: ways of representing a complex sound as a combination of different waves. This allows you to re-create a sound. see visually in stereography

can also see the the fft of an image. (has orientation unlike stereography) can reconstruct an image from its fft.

Noise:

Gaussian noise is most common when observing natural processes

shot noise: bad individual samples (sporadic pops)

Drift noise: linked to time. where sensor becomes degraded

Filtering:

local averaging: local filters average of surrounding local values (use a copy buffer)

median average: gets rid of spot noise really quickly.

Winsorized Averaging: is a combination of median and averaging. It cuts off extreme values and then it averages.

convolution kernel filtering (2D): replacing my value with that of my neighbors. Can give different weights to different pixels/

kernel: 3×3 equal weights. can use it to detect edges etc. ( use imagej to write own filters)

gaussian: 7×7 pays less attention to corners.

Histograms: thresholding – determining foreground and background.

finding the best thresholding: use the random triangle method that usually works. eyeo thresholding is the intersection between different curves. iso thresholding.

Anna

03 Mar 2013

The kinect presentation last week by James George and Jonathan Minard made me start thinking about all the old school sci-fi novels I’ve read, so the idea for my interactivity project is unsurprisingly inspired by one of my favorite books, The Demolished Man by Alfred Bester (1951). I’ve always found the book extremely clever, both in its ideas and in its execution—particularly when it comes to Bester trying to depict what communication via Telepathy would look like in textual representation. Take this passage, for example.

demolishedman

I completely loved idea that people talking with their minds would somehow translate differently in space and time, when compared to normal speech. It not only made the book more engaging, since every page felt like a puzzle, but it also made me wonder about different ways you could represent normal party conversation in a way that better captured its overlapping chaos, serendipitous convergences, and trending topics.

So, with that said, enter my idea: The Esper Room. (‘Esper’ is the term for a telepath in the novel…)

esper_room

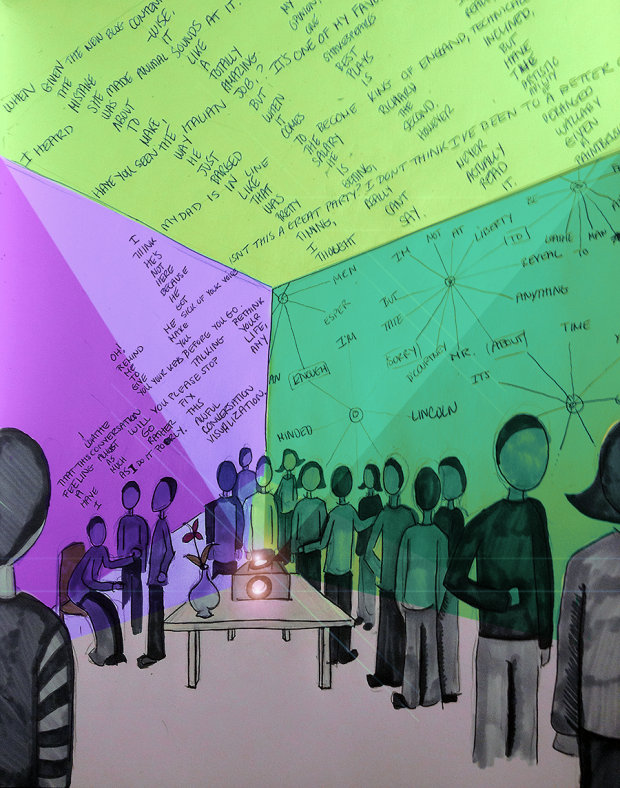
I’d like to create a room where everybody entering is given a pin-on microphone adjusted to pick up their voice only. All the microphones would feed into a computer, where openFrameworks or Processing would convert the speech to text and visualize the words according to some pre-selected pattern (“Basket-weave? Math? Curves? Music? Architectural Design?”). Recurring words and phrases would be used as the backbone of the pattern, and the whole visualization could be projected in real-time onto the walls or ceiling of the room.

Aside from being a nifty homeage to 1950s sci-fi, I think this could be an interesting way to realize that people on opposite sides of a party are actually talking about the same topic. Maybe it could bring together the wallflowers of the world. Maybe it could cause political arguments, or deter people from gossipping. In a way, the installation would be like pseudo-telepathy, because you could read the thoughts of people whom you normally wouldn’t be able to hear. I’m interested in seeing if that fact would have a substantial impact on people’s behavior.

John

03 Mar 2013

project_proposal


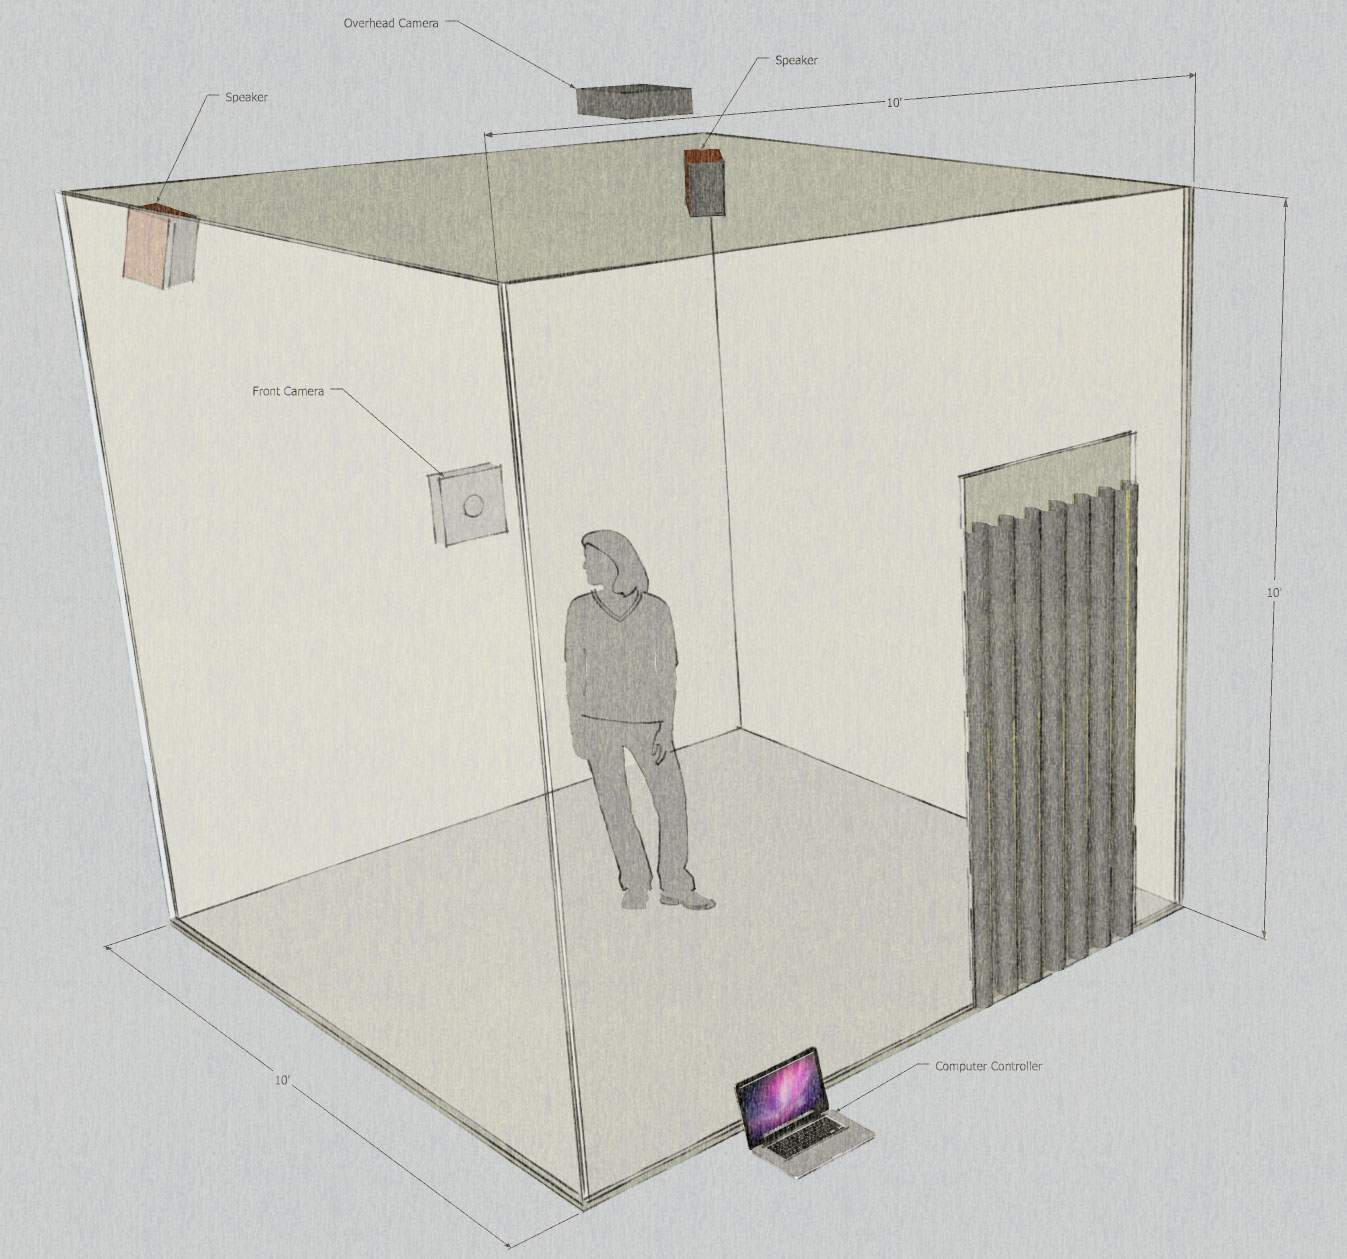
For my third (and possibly fourth) project I’d like to create a room with an overhead tracking camera and and front facing recording camera. Users will walk into the room and will receive a series of commands. User actions and responses will be monitored as commands become increasingly antagonistic and or incoherent. Video and photographic recordings will be made of all participants and streamed on the web.

~Taeyoon

02 Mar 2013

For the love of Samsung

Background

Samsung is a a multinational conglomerate company with it’s headquarter in Seoul, South Korea. Samsung holds financial, political and cultural supremacy in South Korea and is rapidly expanding globally. It is comprised of industrial subsidiaries, as well as entertainment, commodities, food market and much more. It is the archetypical Chaebol, a single family in control of the matrix of corporations and enterprises.
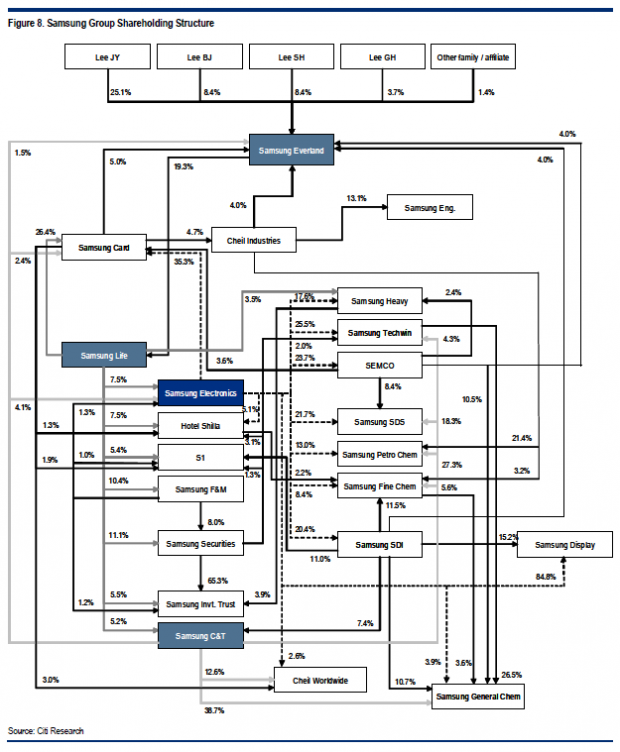
Samsung_Shareholders_CitiAug12

Corporate Group Share holding structure.

[Image 1] This diagram, created by Citi Research, shows much of the assets and profit going into Samsung Everland. It is a company that manages a Samsung theme park in the outskirt of Seoul among other services. It was the heart of controversy regarding illegal inheritance of wealth within the family that resulted in 9 year trial between 2000 ~ 2009.
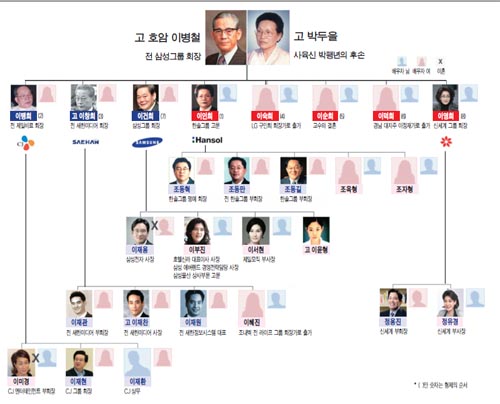
0229-a04-1

An illustrated family tree of Samsung owners.

While Samsung is cherished as the economic backbone and the pride of nation, it also attracts criticism in market monopoly and subsequent inflation, the way wealth and power is inherited and ties to the politics via arranged marriage. The family members attract celebrity-like attention as well as notoriety for their lavish lifestyle and significant role in arts, culture and sports. [Image 2] They are also subject of popular imagination, often times romanticized in K-pop drama series about arranged marriages, scandals and of course, they are the epitome of Gangnam Style.
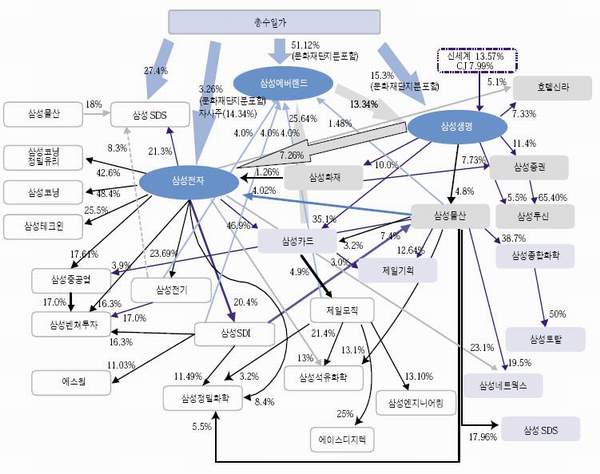
62066_63733_4156

Illustration of C.E.O family and subsidiaries.

[Image 3] shows similar relations as the image #1, however with focus on the relationship between Everland, Samsung Life (insurance), and Samsung electronics. It was found in an online newspaper reporting on the correlations of various subsidiaries and the Chaebol family.

[Image 4] shows the corporate shareholding structure with subsidiaries in different colors. Download this PDF samsung

One of recent issues with the company was regarding passing on of power from Lee Gunhee to his son, Lee Jae-yong as the vice-chairman and his daughter Lee Boo-jin as the head of Everland and Hotel Shilla. Lee Gunhee and the Samsung heirs were accused of stealing from Lee’s father’s trust, as well as series of controversies when he was “found guilty of embezzlement and tax evasion in Samsung’s infamous slush funds scandal.”
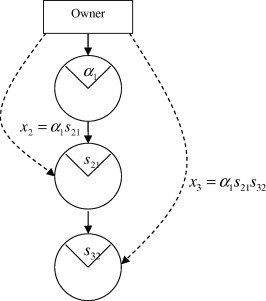
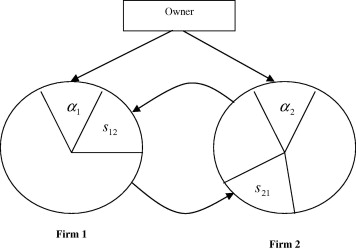
1-s2.0-S0147596711000369-gr21-s2.0-S0147596711000369-gr3 [Image 4/5] Two images on top illustrate Chaebol’s shareholding structure, that is of Pyramidal, on the left and Circular, one the right. Source Their tricks and strategies have been political and social controversy in South Korea, because of it’s tremendous scale as well as how politicians continually forgive their misbehavior. It explains South Koreans’ shared an ‘affective’ relations to Samsung.  

samsungcong

[Image 5] The image illustrates the familiar relationship of different Chaebols, Media and press, and politics. Samsung is the blue terrain that intercepts with most of other conglomerate.

When the power shift is complete, the Lee junior will be the third in Lee family to become ‘the emperor’ of Samsung. It is no doubt that the inheritance of power resembles the family on the North of border.

+ + +

Project Idea

Inspired by Golan’s comment (from the lecture) to work with data that means something to me, I’d like to search for public data on Samsung as well as other private and speculative datas on their shareholding structure. The goal is to create simple and elegant visualization of the network between subsidiaries and the Chaebol family. I appreciate the aesthetics of Mark Lombardi’s simple drawings and research and the technical achievement of They Rule.  While the illustrations I collected for the proposal are interesting, it is largely based on subjective decisions, and have been influenced by their political intentions. I’d like to create an objective view of the network that reflects complexities of the corporate structure.

Technical tasks

1. Identify data. Collect and parse data on corporate shareholding structure, translate necessary information and create a set of csv files that can be used for visualization. I did a brief search online and I fear there might not be a public data available in excel or txt file. I might need to hand craft the data from Annual report, or work with other available data on Samsung.

2. Create 2 dimensional visualization of selected data with Processing or Openframeworks. I will need to learn to use various techniques and libraries. Priority is to create systems which can be used to process various data, because each subsidiaries and sister companies may have different relation to the parent company and the family. The goal is not to create aesthetically pleasing interface, but to become familiarized with working with complex and incomplete sets of data. This is the technically challenging part of the project, therefore I will make a separate post as I make progress.

3. Translate the visualized data to other form. This is where aesthetic interest plays an important role. I’m thinking of using the data to generate 3 dimensional form to 3D print, via OpenScad or Grasshopper with Rhino. I’m new to both platform, so it will take some time to develop. I might call for collaborator on the phase 3 if will be more interesting.

+ + +

Pardon me, this assignment is a month too late. I’ve been super busy organizing workshops and exhibitions in Seoul. Check out some hackers and media artists we met for Demo-Day Seoul. Now I’m back in NY, and will continue to follow this class. I’m impressed and encouraged by other student’s work! The time frame for this assignment will be about three weeks from now, so hope to make visible progress by March 23rd, while I may continue to work on it afterwords.

thanks!

ty
Joshua

28 Feb 2013

Firefly Vision tools + Kangaroo Physics

This is using grasshopper and a physics engine (kangaroo) and firefly (which lets you get data /control other connected devices like camera or arduino). This is a sort of awesome experiment that lets computer vision be used directly in the manipulation of cad objects (spheres in this case).  This basic structure could be used to make some pretty cool stuff.  I really like the idea of creating a more humane interface for cad modeling.  Modeling right now works well but is rather de-humanizing in comparison to clay, wire or pencil and paper.  Computers have the tendency to make one feel like the brain is turning into jello.  Maybe if one could use hand gestures and computer vision to make 3d models it would be a little less alienating.


https://www.creativeapplications.net/openframeworks/hand-tracking-gesture-experiment-with-iisu-middleware-and-of/