Looking Outward – Visualizing Possibilities
This class has got me thinking about both how people visualize things and how they visualize what’s *possible* to do (make, visualize, destroy…) with the tools at their disposal.
Right now, training in the construction of visualizations seems to be through immersion – reading blogs like Infosthetics, Visual Complexity, Boing Boing and the like. Much time is spent dissecting projects individually to try to sort out how they were made a certain way and why. Indeed, that was the structure of most of our class Wednesday – deconstruction and discussion of project after project. But in order to really understand how tools can be used to visualize something, you have to also visualize the process by which those things are created. Sites like Instructables do a very good job of having their members not just show off interesting creations, but also their process of creation through step-by-step instructions. But something is still missing…after looking at my Looking Outward find for this week, I believe we are missing sites that let potential visualizers see relationships between methods of visualization and the visualizations that people have made with them.
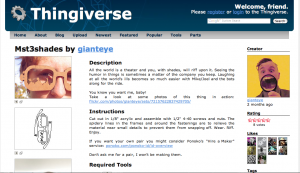
This week, I wanted to chat about a site called Thingaverse. Thingaverse is interesting to me because the site itself is a new way for people to visualize the relationship between tools and things that people have created with those tools. In that sense, it’s a bit of a “meta” visualization.
Take, for instance, these funky looking laser-cut MST3K glasses. In addition to showing the finished product, the site also encourages showing off the 2D .dfx file as an image, and tells people to list the tools used in its construction (“laser cutter”, “3d printer”, etc.) This lets people build a much clearer understanding of why it was possible to make this with the tools chosen.
In addition to showing construction processes for individual projects (which is already possible on Instructables), Thingaverse takes things idea a step farther, and lets people really explore a specific tool’s potential. This is done by letting people tag a project with the tools they’ve used – these glasses are tagged with “laser cutter.” Then, a Laser Cutter page allows people to say “Neat, so this was made with a laser cutter – what else can I make with a laser cutter?” By letting people explore a gallery of built objects by tool, the site effectively crowd-sources a visualization of what *can* be made with any tool people might be considering picking up.
————————–
Why is there no site like this for software visualizations – or most types of software projects in general, for that matter? It’s nice that Processing hand-assembles a library of interesting projects made with that tool, and other individual tools do this as well – but this is more for self-promotion than critical deconstruction of visualization tools and techniques. What I would love is for a site like Infosthetics to really pay attention to the tools used in making particular visualizations, and letting the resulting comparisons between tools give people some feel for what tools they might need to learn to create visualizations of their own.


I totally agree.
I’m relatively new to the visualization space, and I am surprised by the community’s lack of open source code. When I taught myself Ruby (a language with a strong open source community) I learned mostly by reading other people’s code and imitating it. Ruby package repositories and sites like Github exposed me to ways of writing code that I would probably have never experienced otherwise. Budding visualists don’t often have the opportunity to look over an expert artist’s shoulder.
I’ve been thinking about writing an extension to Processing that would make uploading to Github (which has a site feature where sketches could be embedded) as easy as “File/Export”. Maybe if it was easier to post code on the internet more computer artists would be willing to share their process work.