Passionate about giving meaning to data with sexy and elegant visualizations.
Twitter @SamaKanbour
Github samakanbour
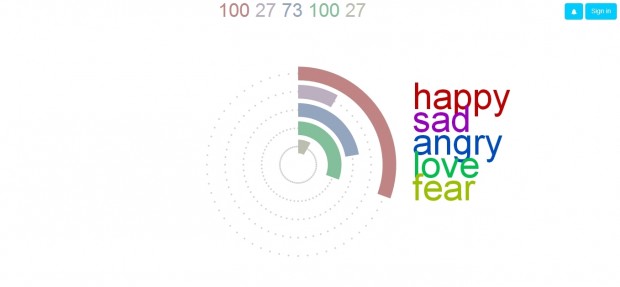
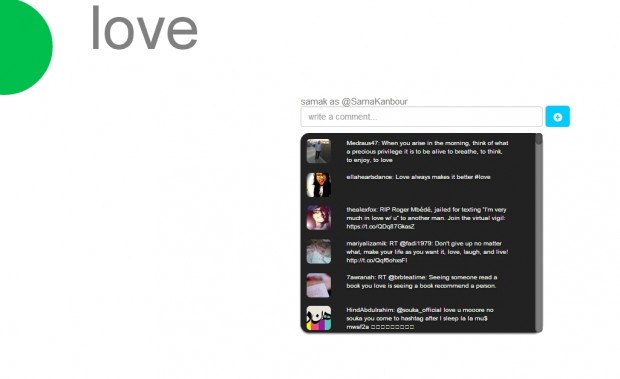
For fun, a fellow classmate and I created a web application that gives an overview about people’s emotions on a particular day, in Doha, Qatar. These emotion vary between happiness, sorrow, anger, love and fear. The application is composed of a graph that shows the ratios of each one of these feelings. The graph updates itself every 25 seconds by fetching data from Twitter. Music notes are played every time a person posts his/her emotion.

