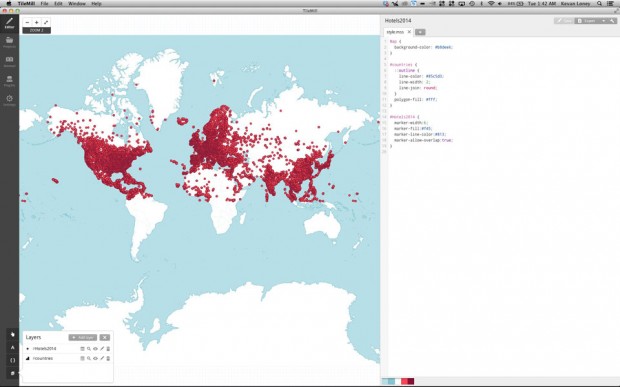
This project was definitely a learning experience for me…
I don’t usually work with this much pure data, so it was quite the curve of figuring out how to use it in an efficient way. I’m still currently trying to figure out the most effective way to use this amount of data to map the coordinates.
My journey started by taking the tilde separated file of the Hotel Data and going through and cleaning it to make it usable. My first attempt caused massive errors when converting it to a CSV file using the ofxCSV addon for openFrameworks. After much debating, I found out a major problem was that there were commas in the tilde file before replacing the tilde with commas! These extra comma screwed my charting of the data from the very beginning… it was such a sad moment when I found out this simple error. So before converting the tildes to commas, I first converted the prior commas of the files to a period. This was the conversion didn’t get confused. This fixed everything, and laid out my data to create a clean CSV file.
The part that gave me even more trouble was plotting these points. I decided to use TileMill… I regret this decision now, due to the fact that no computer I’ve found can plot the mass amount of data through tileMill in an effective way. Every time I try to zoom to another layer or export, the entire program crashes my entire computer.
To try to allow my computer to breath a little (still to little avail) I went through the CSV file and deleted all non essential data. Thus, leaving only the Latitude and Longitude data. This still didn’t provide adequate breathing room for TileMill so I trimmed it a bit more to only plot above the equator. This was the last image I could get out before my computer crashes.
Next time, I’ll stick to openFrameworks, where it seems much more likely that it can handle this much data in a more interactive way. As a whole this experience taught me a lot about large quantities of data, and how I need to learn how to use them more efficiently.
