Looking through the visualizations of datasets, I was surprised by my findings. I was expecting something either monotone, or just plain “digital”. Which in some cases can look appealing or clean-cut. In return, I found that many of the visualization popped out at you with color, with organic wonder, and all around thought provoking visualizations that you can get lost in by the pure aesthetic alone.
The three that I really enjoyed were:
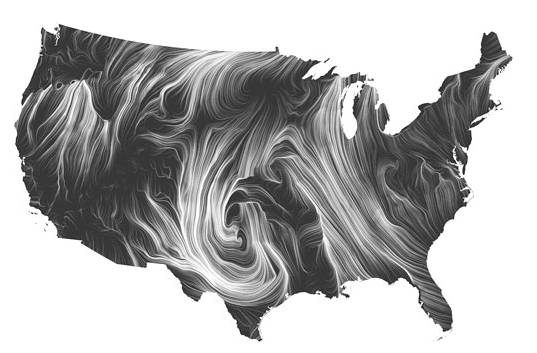
Mark Wattenberg’s Wind Map:
http://bewitched.com/windmap.html
In the wind map visualization, I was overwhelmed with the organic beauty made from the technical data used. The longer you stair at it the more you begin to unfold and find. It’s equivalent of looking at a Van Gogh painting… Getting lost in the push stokes of the data.
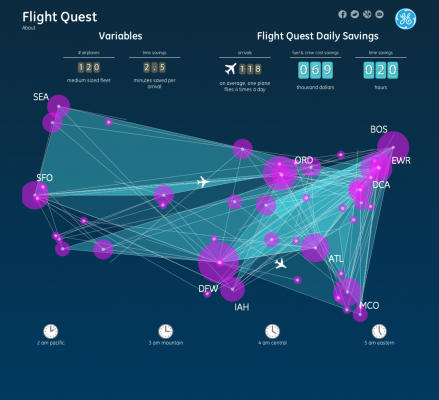
Pitch Interactive’s Flight Quest:
http://visualization.geblogs.com/visualization/flight-quest/
This one I found not only visually appealing and eye catching, but also fun to watch and interact with. I believe the design always helps capture an audience, and this one does just that. It draws you in visually and then keeps you with it’s simplistic design cues and clean animations. All-in-all, this one is one of my favorite’s from a design standpoint that meets and excels at keeping you engaged in the interaction.
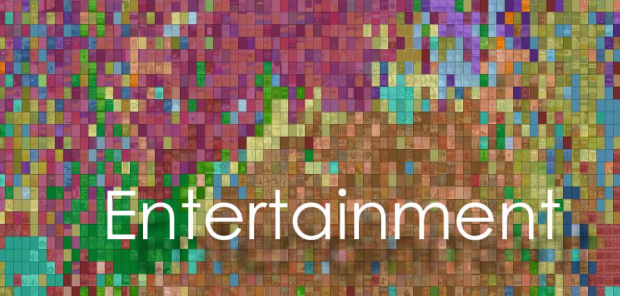
Chris Harrison’s Amazon Map:
http://www.chrisharrison.net/index.php/Visualizations/AmazonMap
These also appealed to me from a visual standpoint. On first glance they reminded me of the classic animating technique of making color scripts for your movie to plan out the color cues/light changed per shot basis. This allows the animation to not only think about storyboarding the action, but the color as well to enhance the story’s emotion, setting, and plot being told. This actually works with this project taking color cues from different covers to create the visualizations. I would love to incorporate this idea into my quantitated selfie.


