Category Archives: Looking-Outwards

Looking Outward : Joel’s Monitoring Tools

Tools to monitor oneself:

Text Analysis : So last year I did a some basic analysis of my sms messages for concepts III. It was a basic python script that blooped out csv data of texts sent by friend and usages of certain words over time (ex, ex). There were a few interesting discoveries but I feel there is still much potential here. I would want to use and iPhone extractor and add on the past year to this data set, then combine it with other interesting variables such as daly calendar, time of day, day of week, etc.

Internet Usage: Exporting google chrome history data, lots and lots of information here.
Data is stored here “~/Library/Application Support/Google/Chrome/Default/History” and will use some open source manager like sql http://www.razorsql.com/download.html to read.


Key Logger http://aobo.cc/ : Why have some of the data when you can have all of the data? I would install a key-logger on my computer. Essentially the most encompassing measurement of my life. Everything I message (fb or imessage), search or google will be available for analysis. Wait, this sounds very intrusive…


Collin Burger

20 Jan 2014

Tool One: Fitbit
The Fitbit Force is a watch that incorporates a multiple axis accelerometer and altimeter to measure steps taken, flights of stairs climbed, distance traveled, number of “active minutes” and reports the time. I got the Fitbit Force for Christmas and have since been using the wristband and Fitbit iOS app in conjunction to monitor my physical activity, food, and drink intake.  I must say that the information provided by these tools has been insightful and very welcome.  I plan to continue using them for the foreseeable future. My caloric intake has changed in response to my recordings and I have become conscious of the amount of physical activity I perform or lack thereof when I fail to leave the house because it is too cold outside. Unfortunately, due to its placement, the Force cannot keep track of my biking activity, so I have to estimate the intensity and duration of my commute. Otherwise, I think it is fairly accurate and a useful tool.

Tool Two: OpenPaths
OpenPaths is a service that uses a smartphone app to track my location (assuming my phone is with me). The data is uploaded to OpenPaths’ servers where I can view my location data and download it in a variety of convenient formats. I’m pretty excited about using this tool to track my location.  It doesn’t require much effort to use it either since it just runs in the background on my smartphone.  In the week that I have used it, I have already become self-conscious about my lack of a social life since it shows that I have essentially been nowhere besides CMU campus and my abode in Lawrenceville. Again, I blame this fact on the cold weather.

Tool Three: RescueTime
RescueTime is a utility that runs in the background of a device and tracks users’ time spent with programs and websites.  It also gives reports that indicate how much time was spent on which activities. I have to thank Ticha’s post for informing me about this tool. I spent all day looking for a tool to track my activities on my computer before seeing it.  I spend so much time on this machine that it would be neglectful to not incorporate my digital activities when quantifying myself.  In the short time that I have used it, I have been impressed by its detail and usefulness.  Also, I plan to incorporate this data into my parametric object project, because I have long wished to create a physical manifestation of my procrastination. I imagine creating a messy 3D print of an object that represents the quality and quantity of things that I use to distract myself on the Internet.

Spencer Barton

20 Jan 2014

Here are some tools that I will use to create a quantified self:

Weekly Planners

planner

I have been keeping a weekly planner for a few years. It has activities, to do list and weekly goals. I will continue to use this tool over the coming weeks which when supplemented by prior years will be a nice data set. On the back of many of the planners I have also written a weekly self evaluation so it may be interesting to see how my views have changed.

There will be a lot of data in this set and none of it is currently digitized. It may be beneficial to focus only on my activities and where I was spending time or perhaps show the progression of my weekly goals.

OpenPaths

2014-01-20 21.10.54

My activities take place at specific locations. With OpenPaths I can show connections between where I am and what I am doing. OpenPaths is an app that simply stores your gps data. GoogleMaps has a similar feature so I will be able to compare.

Finances

I have been recording my expenditures and income for the past few years. This data collection coincides with the weekly planners so I will be able to combine the two. From my finances I will have a sense of where I ate, what shopping I’ve done and when I was working. Most of my expenses are food so these records will be a fairly good indicator of my food intake.

Google Data

Google owns all my data. Luckily they will also let me see what they have (Data Tools). Their maps location history service will be useful as well as my common search terms and common search times. I may be able to combine Google’s activity records with RescueTime’s computer activity records to create a full picture of how I spend my day.

Screenshot 2014-01-20 21.38.40

Emily Danchik

20 Jan 2014

FitBit
I
‘m looking forward to using FitBits, hopefully to track the amount and quality of sleep I get. FitBits, unlike the Nike+, can communicate with Android devices over Bluetooth. The extra convenience of being able to see my data in real time on my phone, rather than waiting to plug the Nike+ into my laptop, will likely promote better habits in the short term.

Ask Me Every
This tool seems like a quick & effective way to track my habits, if I promise to respond in a timely manner. I would probably use this to track how often I cook my own meals, since they’re much healthier and cheaper than the takeout I came to rely on last semester.

Facebook
F
acebook is the preferred means of casual conversation among my friends, family, and classmates. Why not look there for data? In particular, the graph API looks promising. It would allow me to download JSON data about my Facebook friends, which I could then sort to form patterns.

Chanamon Ratanalert

19 Jan 2014

Self-Quantification Tools

On a day to day basis, I find myself thinking mostly of how much sleep I got (especially if I’m feeling the effects of little sleep) and the mood that I’m in that day. I’ve decided that my “Quantified Selfie” will be primarily focused on the aspects of my life that affect my mood and sleep, a common topic amongst students here at CMU. The things I’ve come up with to monitor so far are: how much sleep I get each night, at what hours am I going to sleep and waking up, what mood am I in when I wake up/midday/evening/before bed, how many hours of class do I have each day, how many assignments/tests do I have each day.

The applications I will use to monitor these things are a Fitbit, AskMeEvery (http://askmeevery.com), and MoodPanda (http://moodpanda.com/).
The Fitbit will be used to monitor my activity throughout the day. Some days, I may be more exhausted due to physical activity instead of sleep deprivation, so I’ll need to take that into account. Additionally, exercise can put you in a better mood, with all the chemicals and adrenaline. It can also note which days I have dance, depending on how little other exercise I do, which usually puts me in a better mood. I will also use it to monitor my sleep. The Fitbit has a lot of versatility, tracking things like activity, weight, calories, and sleep. I will use it to monitor how well I am sleeping each night. I can then go back and relate this to what my day was like. The Fitbit also features a mobile app, so I can use that to monitor my activity on the go.
I will use AskMeEvery to ask me questions throughout the day to monitor that day’s data, such as what times I wake up and go to sleep, how many hours of class I had that day, etc.
I will use MoodPanda to record my daily mood and monitor that progress over time.
Depending on the direction that my project goes, I might also track what foods I am eating. I tend to eat my feelings, so junk food comes into play eventually as the semester progresses. Unhealthy foods can also make you feel more lethargic. To track this, I will use MyFitnessPal to track what foods I am consuming each day. I can also input specific activities (Ex: one hour of dance) to relate to what the Fitbit monitors of my activity.


Crossman-LookingOutwards-2

The following three services I believe will track the vast majority of my activity during the semester. There is a service that will track my activity and sleep, where I go, and what I am doing on my computer, which I spend way too much time on.

Fitbit

I chose the Fitbit because of its versatility not only as an activity monitor but also as a sleep tracker. From this device and its accompanying software I will be able to monitor and plot how active I am and how well I recuperate at night.

PlaceMe

PlaceMe is a mobile app that automatically logs your location without needing your input. It runs on Android and iPhone.

Rescue Time

Rescue Time is an application that tracks your computer useage, complete with web and application activity. It tracks where you go, what apps you use, how long you are using them, and also categorizes your activity. So this product can call you what percentage of the time you are slacking off.

Nastassia Barber

19 Jan 2014

For the first time I regret having a Windows phone, because there seem to be no mobile apps I can use.  I don’t normally use a lot of apps, so I had no idea how lacking they were until now.

1. Daytum

I like this website because it allows you to track a bunch of different things in the same place and play with different ways of displaying the data.  I might use this to track standard things like what I eat or how much I exercise, or I might use it for something more unusual like how long it’s been since I sent a text or since I forgot something.

2.  Mood Panda

I might use this to track my mood, especially since it also lets you add a reason.  It doesn’t impose any particular update schedule, so I would impose my own so the data isn’t affected by when I feel like updating it.

3. Ask Me Every

This is useful because it reminds you to log your information each time.  I might use it to track how many cups of coffee I drank (in an effort to decrease this) or daily pain levels.  I really like that it uses texting because I can log things without being at my computer (and on my windows phone…)

MacKenzie Bates

19 Jan 2014

FitBit/Nike+ Fuel Band

FitBit and the Nike+ Fuel Band are both activity monitor bracelets.  The Nike+ Fuel Band seems to focus more on athletic activities. Whereas FitBit seems to focus on a more holistic approach and even includes a sleep tracking system. If we did get FitBits (which I really hope we did), then I’ll wear both activity bracelets so I’ll collect mega-data.

RescueTime

RescueTime monitors how you spend your time on your devices. For computers it measures how long you use applications and visit webpages, and then gives you a productivity pulse to visualize how well you are spending your time. I will be interested to see how well I actually spend my time and if it possibly makes me more productive.

AskMeEvery

AskMeEvery is a nice website for logging personal data of any type on a daily basis. You are reminded daily via text or email to respond. I will be using it an excessive amount :]

Every single day I will answer the questions:

  • How long did I sleep last night?
  • How productive was I today?  (0-4)
  • How stressful was today?  (0-4)
  • How creative was I today? (0-4)
  • Level of eccentricity? (1-7)
  • Gimme a random number? (0-100) [just curious if a trend will develop]
  • Gimme a letter! (aA – zZ) [curiosity once again]
  • How many servings of fruit?
  • How many cans of soda?
  • How many new songs did I find?
  • How many times did I shower?
  • Hatred of mainstream? (1-11)
  • How long did I play video games for?
  • Who are you comrade question? (1 – 10) [which is a rating of how annoyed I am with having to answer the questions]

Ticha Sethapakdi

18 Jan 2014

A dataset I find interesting: A More Perfect Union by Luke DuBois 
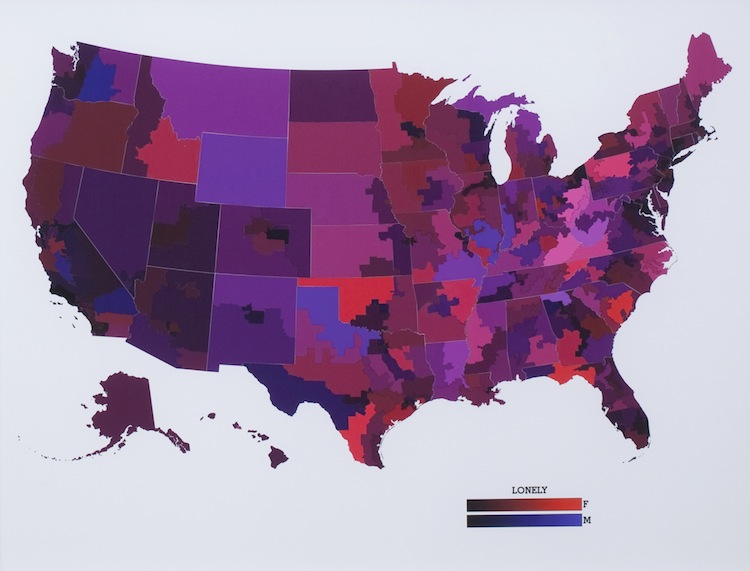
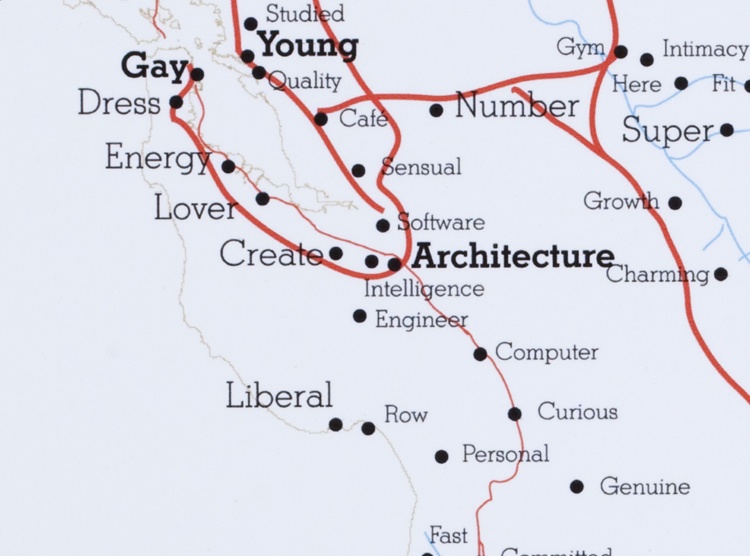
If I could, I would just classify this as an interesting dataset, provocative project, and well-crafted work and be finished with my Looking Outwards entry–but I won’t. In A More Perfect Union, DuBois used data collected from 21 different dating sites to create a “a road atlas of the United States, with the names of cities, towns, and neighborhoods replaced with the words people use to describe themselves and those they want to be with.” He also created national maps that were color-coded based on how frequently a certain word was used in a person’s profile. It’s amazing to see the sheer wealth of data contained in these maps, and the portrait they paint of the single (or not) dating site users of the United States is, at the same time, beautiful, heartbreaking, and amusing. With the growing community of online dating users, it would be interesting to see how the data changes from year to year. To push the idea even further, it would also be interesting to see how the data differs from country to country. (Though it’s unlikely this project can be developed further because when DuBois visited our class last semester, he mentioned running into some trouble with the online dating sites later….)


A project I find well-crafted: Spamghetto wallpaper 

Described as “inappropriate”, “intriguing”, and “irresistible”, Spamghetto is a special type of wallpaper which, as the name suggests, manages to put spam into some use by exhibiting it in an aesthetically pleasing manner. What appeals to me about this project is that it is both a visualization of information and serves an artistic / decorative purpose–this makes it a project that is as beautiful as it is interesting. The fact that the information is not visualized as a simple poster, but an entire wallpaper that spans an entire room raises our awareness of how we are bombarded with spam and the like on a regular basis, which I believe is a unique and well-crafted way of visualizing information.


A project I find provocative: 138 Years of Popular Science

In 2011, Jer Thorp was asked by Popular Science magazine to make a graphic that “explored the archive of their publication”, and decided to make something that demonstrated how the “different technical and cultural terms have come in and out of use in the magazine since its inception.” His design certainly has visual appeal, but it is thought-provoking at the same time because it shows how tech-culture has evolved over the years. Additionally it is interesting to see how the color schemes of the magazine covers (represented by the nodes surrounding the years) also went through an evolution as the decades progressed–what I found particularly fascinating was how there was suddenly a lot of color in the mid to late 1900’s, but as the years progressed, the colors began to revert back to the less saturated ones reminiscent of those found in the earlier issues. Because the magazine’s publication spanned almost 140 years, compiling the information was a long and arduous process–when he talked about how he had to organize the data, compile custom datasets, and go through a “mountain of iterations” before achieving the final product, I suddenly realized just how much work InfoVis requires. From that, I gained a newfound admiration for the InfoVis designers and applaud the above artists for creating works that were both informational and visually appealing.

Andrew Russell

17 Jan 2014

Admire – Cindermedusae

Cindermedusae parametrically generates a 3d model of a jellyfish-life creature. It then takes that model and animates it as if it were moving through water.
I greatly admire this project since it simulates organic lifeforms in a realistic way. However, instead of generating typical looking jellyfish, the author added a cool touch and made the jellyfishes’ look inspired by Ernst Haeckel.

I have been really interested in simulations for a long time, so seeing a simulation relating to biology (of which both my parents have degrees in) is even more exciting to me.

Disappoint – Game Tree Interactive

http://infosthetics.com/archives/nadal_game_tree2.jpg

Game Tree Interactive builds the above tree representing every single tennis game that Rafael Nadals has played. In each circle above, a red circle means that the opponent was winning the game at that point, a white circle represents a tie, and a blue circle represnets Rafael Nadal having the lead. I think that this project is interesting and informative, eg he has never lost a game 40 – love. However, I am a bit disappointed with it since it falls short on the interactive side. The only part that is interactive is hovering over each line shows the total number of points won or lost at that stage in the game. I was personally expecting something more.

Surprise – The Flavor Connection

The Flavour Connection shows a 2d graph of a large number of foods where each column represents the food category, and each row represents how many other foods are connected to each food in that row. The size of each dot on the graph represents how commonly the food is found in recipes, and any two dots connected by a red line show how many flavours are shared between the two foods. I was not expecting much when I clicked on the project. I thought it would be just another infographic. But I was quite surprised at the detail and the intuitive interactivity done in this project. I lost a lot of time simply exploring the graph for flavour connects. Did you know that roast beef shares a flavour with 49 other graphed foods yet regular beef only shares 19?