## Background ##
In spring this year, people in northern China experienced severe weather with extreme dangerous sand storm and air pollution. One of dangerous factors in air pollution is PM2.5, which at that time was 400 times over the most dangerous level defined by WHO.
However, PM2.5 data was not open to public in China until recently. The studio BestApp.us in Guangzhou, China collected and veirfied data from official sources, and opened API to public. Therefore I decided to build a website with visualization to help people easily find dangerous level in their own cities.
## Design 1 ##
Map visualization:
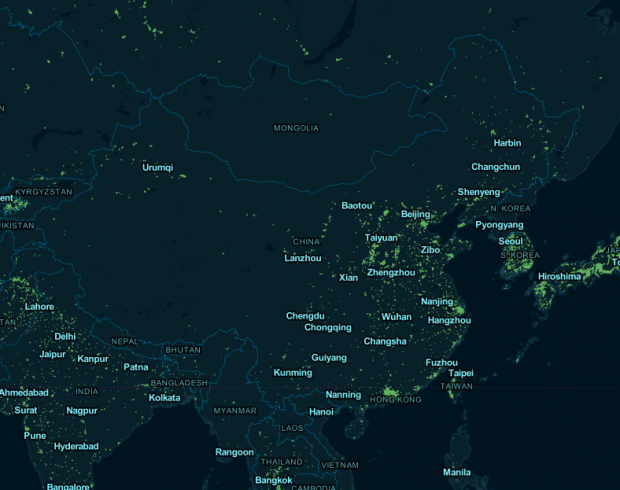
I got PM2.5 data of 74 cities in China with 496 air detection stations. Since the data not only includes PM 2.5 value but also contains air pollution with SO2, NO2, PM10, O3, the website will allow users to choose the which air pollutant they want to view.
Visualization Tool: TileMill, D3.js, Processing.js
## Design 2 ##
PM2.5 history data for each city in China. When users click on a label on the map, they can not only get the current PM2.5 value but also are able to scan PM2.5 history for the specified city.
## Tech ##
Server: Node.js, Express and MongoDB
Data: PM25.in
Github Repository: https://github.com/hhua/PM2.5
Notes from comments:
- Cosm / Pachube open data for PM2.5
- whether a map should be the main (or ONLY) entrance to the data
-
include some basic information about these pollutants and how to protect yourself (if possible) on the website. Accessible public service information would definitely be helpful
- how you visualize over wide areas
- Will you be able to zoom in/out, and thereby get a greater/lesser resolution of PM2.5 distribution
-
What is the important part of the data? How people want to see this way of visualization?
- Immediate concerns include interpolating data across geographic features that aren’t well-categorized, which is a proven hard problem. There’s also the interesting ethical question of providing people with data that indicates imminent or constant danger without also providing them a means of acting on it.
