Category Archives: looking-outwards

Patt

04 Feb 2013

FoodMood  by Affect LabAi Applied and Jana + Koos

foodmood

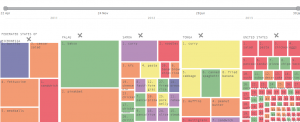
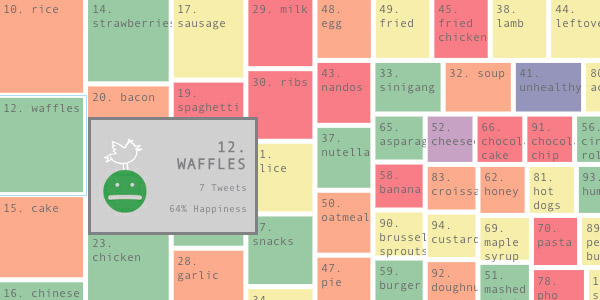
FoodMood is a data visualization that shows the relationship between food and the impact it has on the eaters’ mood. The data is collected from food related tweets in English across several countries. Each food item is represented in square blocks of different sizes, based on the number of times the food is mentioned. The range of colors of the squares represents different sentiments from positive to negative.

I find this data set very interesting because it shows the culture difference based on the food people are eating. It’s very interesting to see that, from April 22, 2012 to Feb 4, 2013, chicken was mentioned in 9188 tweets in the United States compared to 34 tweets in Thailand and 2 in Afghanistan. It can surely tell that the United States contributes to a very large consumption of chicken. Another interesting thing I find from this dataset is the fact that some countries have a lot less tweets than the other. This can illustrate one of two things – one being how influential food is to people from different countries, and the other being how accessible to the internet (twitter) are people from different countries.

Asterank by Ian Webster

asterank

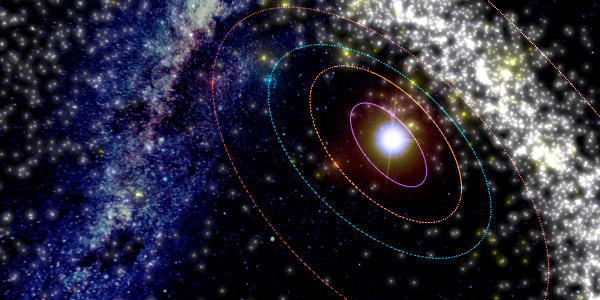
With a database that contains astronomic locations, economic, and scientific information of more than 580,000 asteroids, Asterank accurately models the asteroids in our solar system. Just looking at the 3D model, I was amazed by how much information is gathered to make this data visualization. Not only that the information is so rich, but the model is also very well crafted. I like how the model is interactive, with the option to rotate and zoom in or out, making it accessible for viewers to see the asteroids in different angles.

OrgOrgChart by Justin Matejka

OrgOrgChart (Organic Organization Chart) is a data visualization that looks at the evolution of a company Autodesk’s over time. The data was taken from May 2007 to June 2011, which is a span of 1498 days. The entire organizational hierarchy is constructed as a tree with an employee as a circle connected to his or her manager. The bigger the circle, the bigger number of employees working under one manager. It is interesting to see the changes of employees being made in a big company’s structure over time. This infoviz really shows that people come and go, and that there are changes happening in an organization every single week. I think that the data is very well presented. The graphics captures the audience very well with the choice of colors and the animation. It might be difficult to see the detailed organizational difference, but it is pretty easy to grasp the big idea of how an organization evolves over time.
 

Erica

04 Feb 2013

I know I’m a little bit late on this post but here are some data visualization projects that I liked. It was hard for me to choose just three because this is a field I’m very interested yet have little experience in so here is a longer-than-asked-for list:
1. silenc by Momo Miyazaki, Manas Karambelkar, and Kenneth Aleksander Robertsen
This project is an exploration of those excess letters that do not contribute to a word’s pronunciation. The artists implemented this exploration in two ways: they colored the silent letters red while leaving the pronounced letters black so that one could read using all of the letters or only the pronounced letters by utilizing a red filter to hide the silent letter. They also created two copies of the same text, one with the pronounced letters only and the other with the silent letters. What struck me so much about this project is the simplicity of the subject matter and how easily it is taken for granted. We are so used to seeing and reading words the way that they are acceptably spelled that we don’t pay attention to the access. This begs the question of how easily can a text be read without the access information. The artists cleverly and successfully provide an outlet for each individual to try to answer this question for themself.
2. Time-Lapse Writing of a Research Paper by Timothy Weninger
For this project the artist creates a time-lapsed video of his progress from working on a research paper. I thought that this project was very well executed in that it easily communicates the rate of progress and the relationship of different steps in the progress of the artist’s research. What really adds to the video is the subtleties of the changes the artist made at various points in time. You can see his aesthetics sensibilities at work at the slight re-sizing and re-positioning of the various images that accompany the text.
3. Time Running Parallel by Xárene Eskandar
I particularly like the concept behind this project that explores the “perceptual qualities” of time by superimposing strips of the same scene at different periods of time. As a result, small movements and changes in the landscape become heightened and much more noticeable so that the subtleties of time passage is more enhanced and be better appreciated.
4. These next few projects do a good job of taking a lot of data and condensing it into a clear visible diagram that is readable to even someone who is ignorant to the knowledge:
a) Calendar of Meaningful Dates
This projects assigns each day of the year a size based on its referral by name (i.e. “February 14th” as opposed to “Valentine’s Day”). It very simply and concisely explains intricate relationships between people and different times of the year by distinguishing between “ordinary” days and days that have sub-textual meaning or association in the minds of the masses.
b) An Infographical Look At Walking Dead Kills Over Three Seasons by Andrew Barr and Richard Johnson
I really love the aesthetics of this project that (as the title so concisely describes) depicts the amount of zombies each character in the show Walking Dead creates during each season. What’s really great about this diagram is that I have never watched the show and yet can easily understand the information that is being portrayed. The importance in this diagram is not necessarily on the specific number of zombies created by each character (which it does in fact include), but rather the visual comparison of the number of zombies both between characters and between seasons depicted using varying densities and colors. Lastly, as I mentioned, I think the aesthetics are very well-though out and executed.
c) Futures in Literature From the Past by Giorgia Lupi
I am drawn both to the subject matter and the aesthetics of this project. It depicts for a number of novels the relationship between the year a certain book was written and the year in which the same book describes a fictional future event occurring. Further, it categories these future events based on what kind of impact each has. As such, the project creates an interesting fictional timeline of how future “history” could play out and allows one to see some of the nuances of what one might to change of the present day.
d) Billionaires of the World Ranked and Charted
This project provides an interactive tool for analyzing and comparing the billionaires of the world. Not only does the tool provide a very clean-cut interface that is easy to use and read, it further provides a number of different formats through which the information can be viewed and digested, along with a number of filters to deal with a more limited amount of data at a time. This project is really great at getting the information across and at giving the user an opportunity to manipulate the data they are dealing with.
5. These next few projects deal with different types of sports related data and each provide interesting and unique ways of representing the data they are dealing with:
a) Statistical Network of Basketball by Jennifer Fewell and Dieter Armbruster
I may be intrigued by this project due to the fact that I am currently taken probability and statistics but nevertheless I think that it is a really interesting way to view and analyzing a sport and the various movements/motions that compose that sport. This diagram provides a probabilistic model of the movement of a basketball during a basketball game. I find it to be an extremely interesting, simplified way to view a game which is actually quite nuanced and complex, particularly given that it shows that keeping possession a basketball once you have it is very likely. I think it would be a good exercise to do a study of these diagrams at different levels of play to see how the game changes with experience.
b) NFL Video Screens Compared
This is a relatively simple project that displays the relative sizes of NFL video screens at different stadiums. It is a very small data set in comparison to some of the other projects I have mentioned but it says a lot using so little information. The size of the video screen can be inferred to show the amount of money a given team has, and thus perhaps the amount of money and/or interest/support a team may have from its home city.
c) NFL Fans on Facebook Based on Likes
As the title indicates, this diagram depicts the support of a given region of the USA for a given NFL team. For this project, it is not so much the data or the visualization that intrigues me (though it looks pretty, what it shows is fairly predictable), but rather where the data is coming from. Facebook allows users to be tagged as a “fan” by simple clicking likes but does not require watching of actual games or following their team to any real extent. In this, it is possible to get a much more “full” distribution of than what would be expected.
6. Animated Growth of an Organization by Justin Matejka
This project visualizes the changes in an organization by representing the adding and lost of employees and the transfer of employees from one manager to another. Aesthetically, it is very successful in that it is very intriguing to watch and easy to understand. What I find most interesting about the end result is how organic it looks, so that the organization functions as a living organism instead of a structured, rigid entity. I think that this provides a new outlook on the role of capitalism and employment in the US.
7. Wood Charts Reveal Layers of Underwater World
This project depicts a map of the under-sea-level world through laser-cut layers of wood. I love this project because of the tactile feel it gives to the information it portrays. It no doubt could have been done as a digital project, but the physicality of the dips and grooves give the viewer a better understanding of what is actually going on.
8. Pinball Machine as Etch-A-Sketch by Sam van Doorn
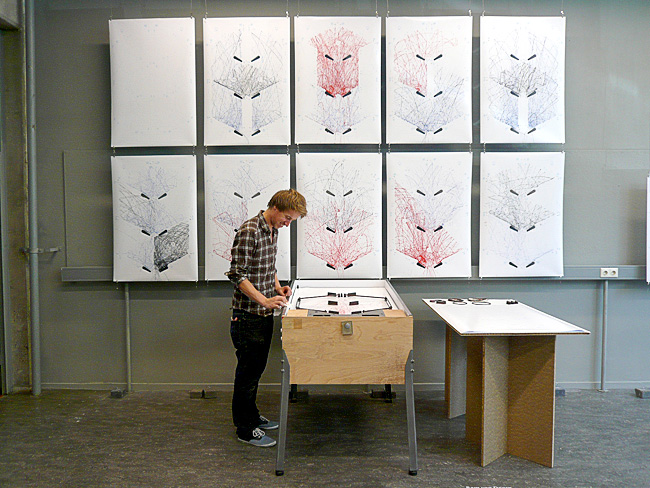
This project tracks the life of a pinball during a game by letting the pinball paints on a poster beneath the flippers. What is interesting about this project is the potential for widely diverse or similar outputs and what that says about the skill of the player. It would be cool to compare the paths made by a variety of players, particularly if each pinball gets a different color of paint so that the longevity of one player’s single pinball as opposed to another is also recorded.

Andy

03 Feb 2013

Yay!

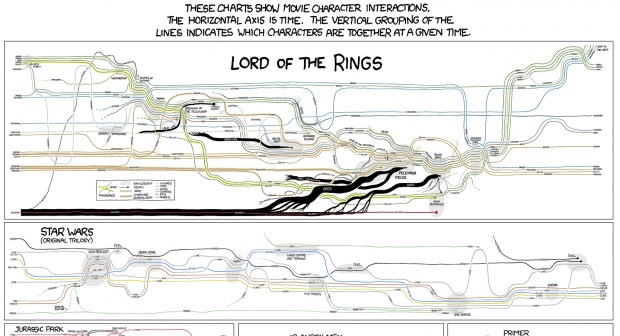
1. A data set that I find interesting: XKCD’s Movie Timeline visualization (http://xkcd.com/657/large/). Here’s a screenshot, but you really need to go to the site and play around with it to appreciate it. charts

The work is a really nice way to academically approach something totally fantastic and pop-cultural. I also appreciated the bit of humor there with the last couple graphs on the bottom.

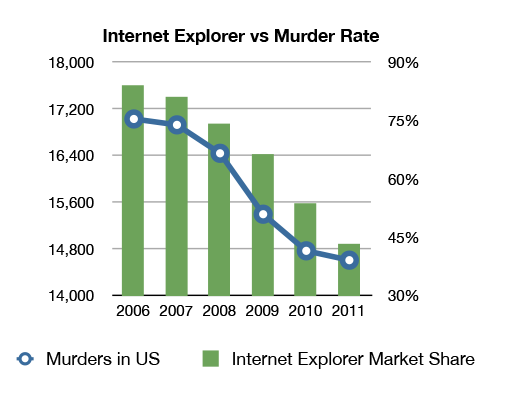
2. Something I find provocative: Internet Explorer Market Share vs US Murder Rate. ie. I think the piece tells a comedic story on the surface about a piece of technology which I abhor, but also tells a story about the cultural relevance and authorial intent behind data visualizations. This piece is just absurd enough that only conspiracy-theorists would actually think that the data is related, but it certainly serves as a satirical warning to viewers that they really look at what is being visualized and not just accept conclusions because pictures are pretty.

3. Something I find very well crafted: The Psychology of Music (LINK). Growing up as a cellist, I’m already a fan of music education and all the positive benefits which come from it, but the presentation of this data visualization is just so flawless. The design is great – graphics which can explain the content to small children, but with data that could persuade a fully capable adult. The colors are good, the spacing is good, and as a scrolling piece it works very well in the web browser. I haven’t tested on a mobile web browser, but if it also looks this good on my phone then this piece really hits it out of the park for me

Nathan

31 Jan 2013

Lets start with this delicious piece of generative animation and sound.

Partitura 001 from Quayola on Vimeo.

Partitura 001 by Quayola is by far one of the most aestetcally creative, interesting and beautiful things I have seen in an long time. Maybe it’s because I don’t always see generative works of such precision and graphic luster. The linear horizontal composition makes this very painting-analogous and I am drawn to such a visually dominant piece. This dominance takes me by surprise as it is challenged by the ever increasing volume and complexity of the audio score that it is being generated from. Just excellent work.

Bicycle Built for Two Thousand from Aaron Koblin on Vimeo.

This is a combo, Data-vis and Generative work because of the collection of voices and the compilation of these with a program to generate the average and compile the song. I really love the crowd source element and the overall concept and execution were done well. I think that this should be a single element in an on-going series or apart of a bigger piece (installation?). 2280352327_99a0fb2bcc_b

Above is a still from Leander Herzog’s Lasercutter works. The flowing lines are nothing new, but the repeated execution through the album is very nice. I think I am drawn to topographical elements on top of existing topography because it calls to question the cause  and purpose the lines play with the ‘lumpy’ form of the wooden surface. Good stuff. Check out the whole thing before you get off the site!

Andy

30 Jan 2013

It’s my generative music post!

1. Technique – Cellular Automata in Wolfram Tones (http://tones.wolfram.com/about/how.html). Wolfram Tones is a generative music application which uses simple rules to create complex structures. Based on Wolfram’s work “A New Kind of Science”, all the possible cellular automata are lined up in the program, and each time a score is generated the program picks one. That automata is then drawn in Mathematica, turned on its side, and then more Mathematica functions decide how to convert the drawing into notes. I played around with Wolfram Tones for a bit and I was very impressed! The computational power of simplicity is astounding.

2. Something cool – Sonar by Renaud Hallee.

Sonar from Renaud Hallee on Vimeo.

Sonar is a beautiful animation accompanied by a program which generated the score from the animation. I looked pretty hard to find a paper which could explain how such great music was generated from an animation like they claim, but alas I couldn’t find an explanation. The simplicity of the project again, and the timbre and selection of the tones really makes for a beautiful experience.

3. Another cool thing – Max/MSP Generative MIDI Patch by Fletcher Patch

This is a ridiculously unnecessarily complicated structure which generates MIDI from a MAX/MSP patch. I really like the orchestration of this piece in particular. No matter what was played by these instruments, it always sounded good and had a very nice and soothing yet intricate and complex texture to it. I think I want to make some generative music in my next project, and I don’t know whether Max, Pd, or even something else will be the platform of choice, but by looking at this patch I can definitely at least start with something that should sound good

Alan

30 Jan 2013

Aaron Koblin

I can’t say he is not the most creative guy for visualization art. This is a TED Talk for briefing his collection of works. It is important to notice the medium of art is transforming from novel to movie, and movie to interface. Below I will show two projects by him with different ideas.


Johnny Cash Project

Johnny Cash Project is a visual project for recollection of Johnny Cash and his spirit. It allows global collaboration to share fans’ vision of Johnny Cash by recreate frames of MV “Ain’t no Grave”. Below is how it works.


The Wilderness Downtown

Instead of the case of Johnny Cash Project in which people globally together complete a work, The Wilderness Downtown is a project where a small group of people generate video art for different users based on their places of birth using HTML5 experimentation. You may check the link.

Hans Rosling – GapMinder

Hans Rosling is a world-known Swedish educator and data visualization expert. Above is a TEDx Talk he made in Doha, where TEDxSummit happens. In the video, he is using the software Gapminder made by himself. The gapminder has an advantage to represent data in more dimensions than originally tools can do. It is later developed by Google into Google public Data Explorer, which I used in my degree thesis.

Bueno

30 Jan 2013

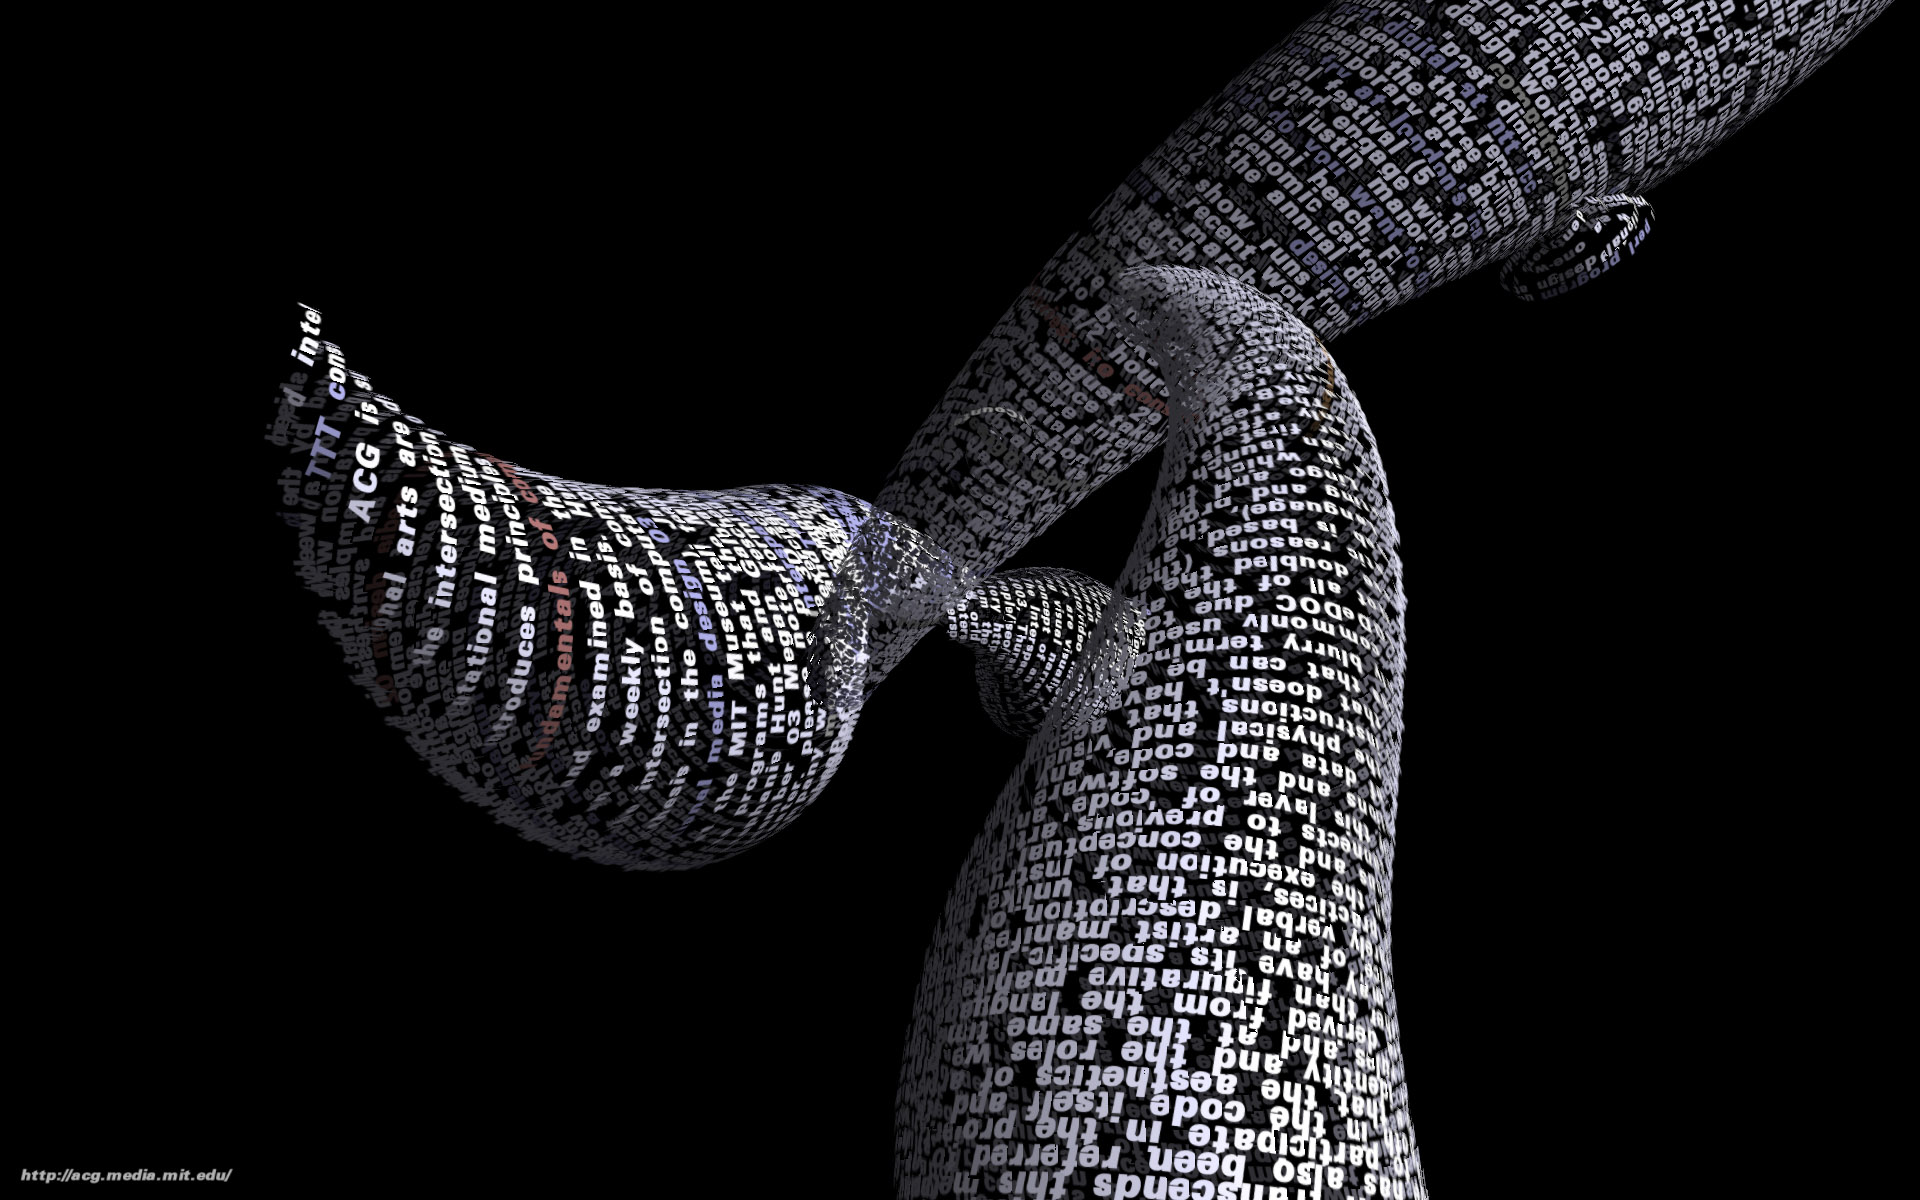
Okay, so I’ll start off this post with an ancient little something from Ben Fry himself, a web browser called tendril. It’s a wonderful little piece of software and a great reminder that our desire and overriding concern for functionality can prevent us from examining just what forms our tools can take. This web browser generates typographic structures from the words on web pages. These digital sculptures resemble, appropriately enough, tendrils or thick roots. Any links on the web page are colored differently and may be clicked, spawning a new tendril-page off of the old one. As an intersection between information visualization and generative form, I feel this is an important (relatively old) exploration of just what was possible.

http://benfry.com/tendril/movie.html


Next up I figured I would mention Entropy, the spawn created when esoteric programming languages meet the glitch aesthetic. For those unaware, esoteric programming languages seek to utterly subvert typical programming language conventions (and logic) while remaining Turing complete. You can certainly program in such languages, but they would be impossible to use on a regular basis.

Entropy fucks up your years of imperative programming use by forcing you to let go of the rigid assumption that your data is relatively stable barring some terrible mistake or accident. See, in Entropy, values change as they are accessed in small increments. The result is the eventual breakdown of a program’s output.This is fascinating, as it is generative whether or not the programmer wants it to be – he or she doesn’t even get to set any baseline parameters like in other conventional generative works.

See more here: http://esolangs.org/wiki/Entropy


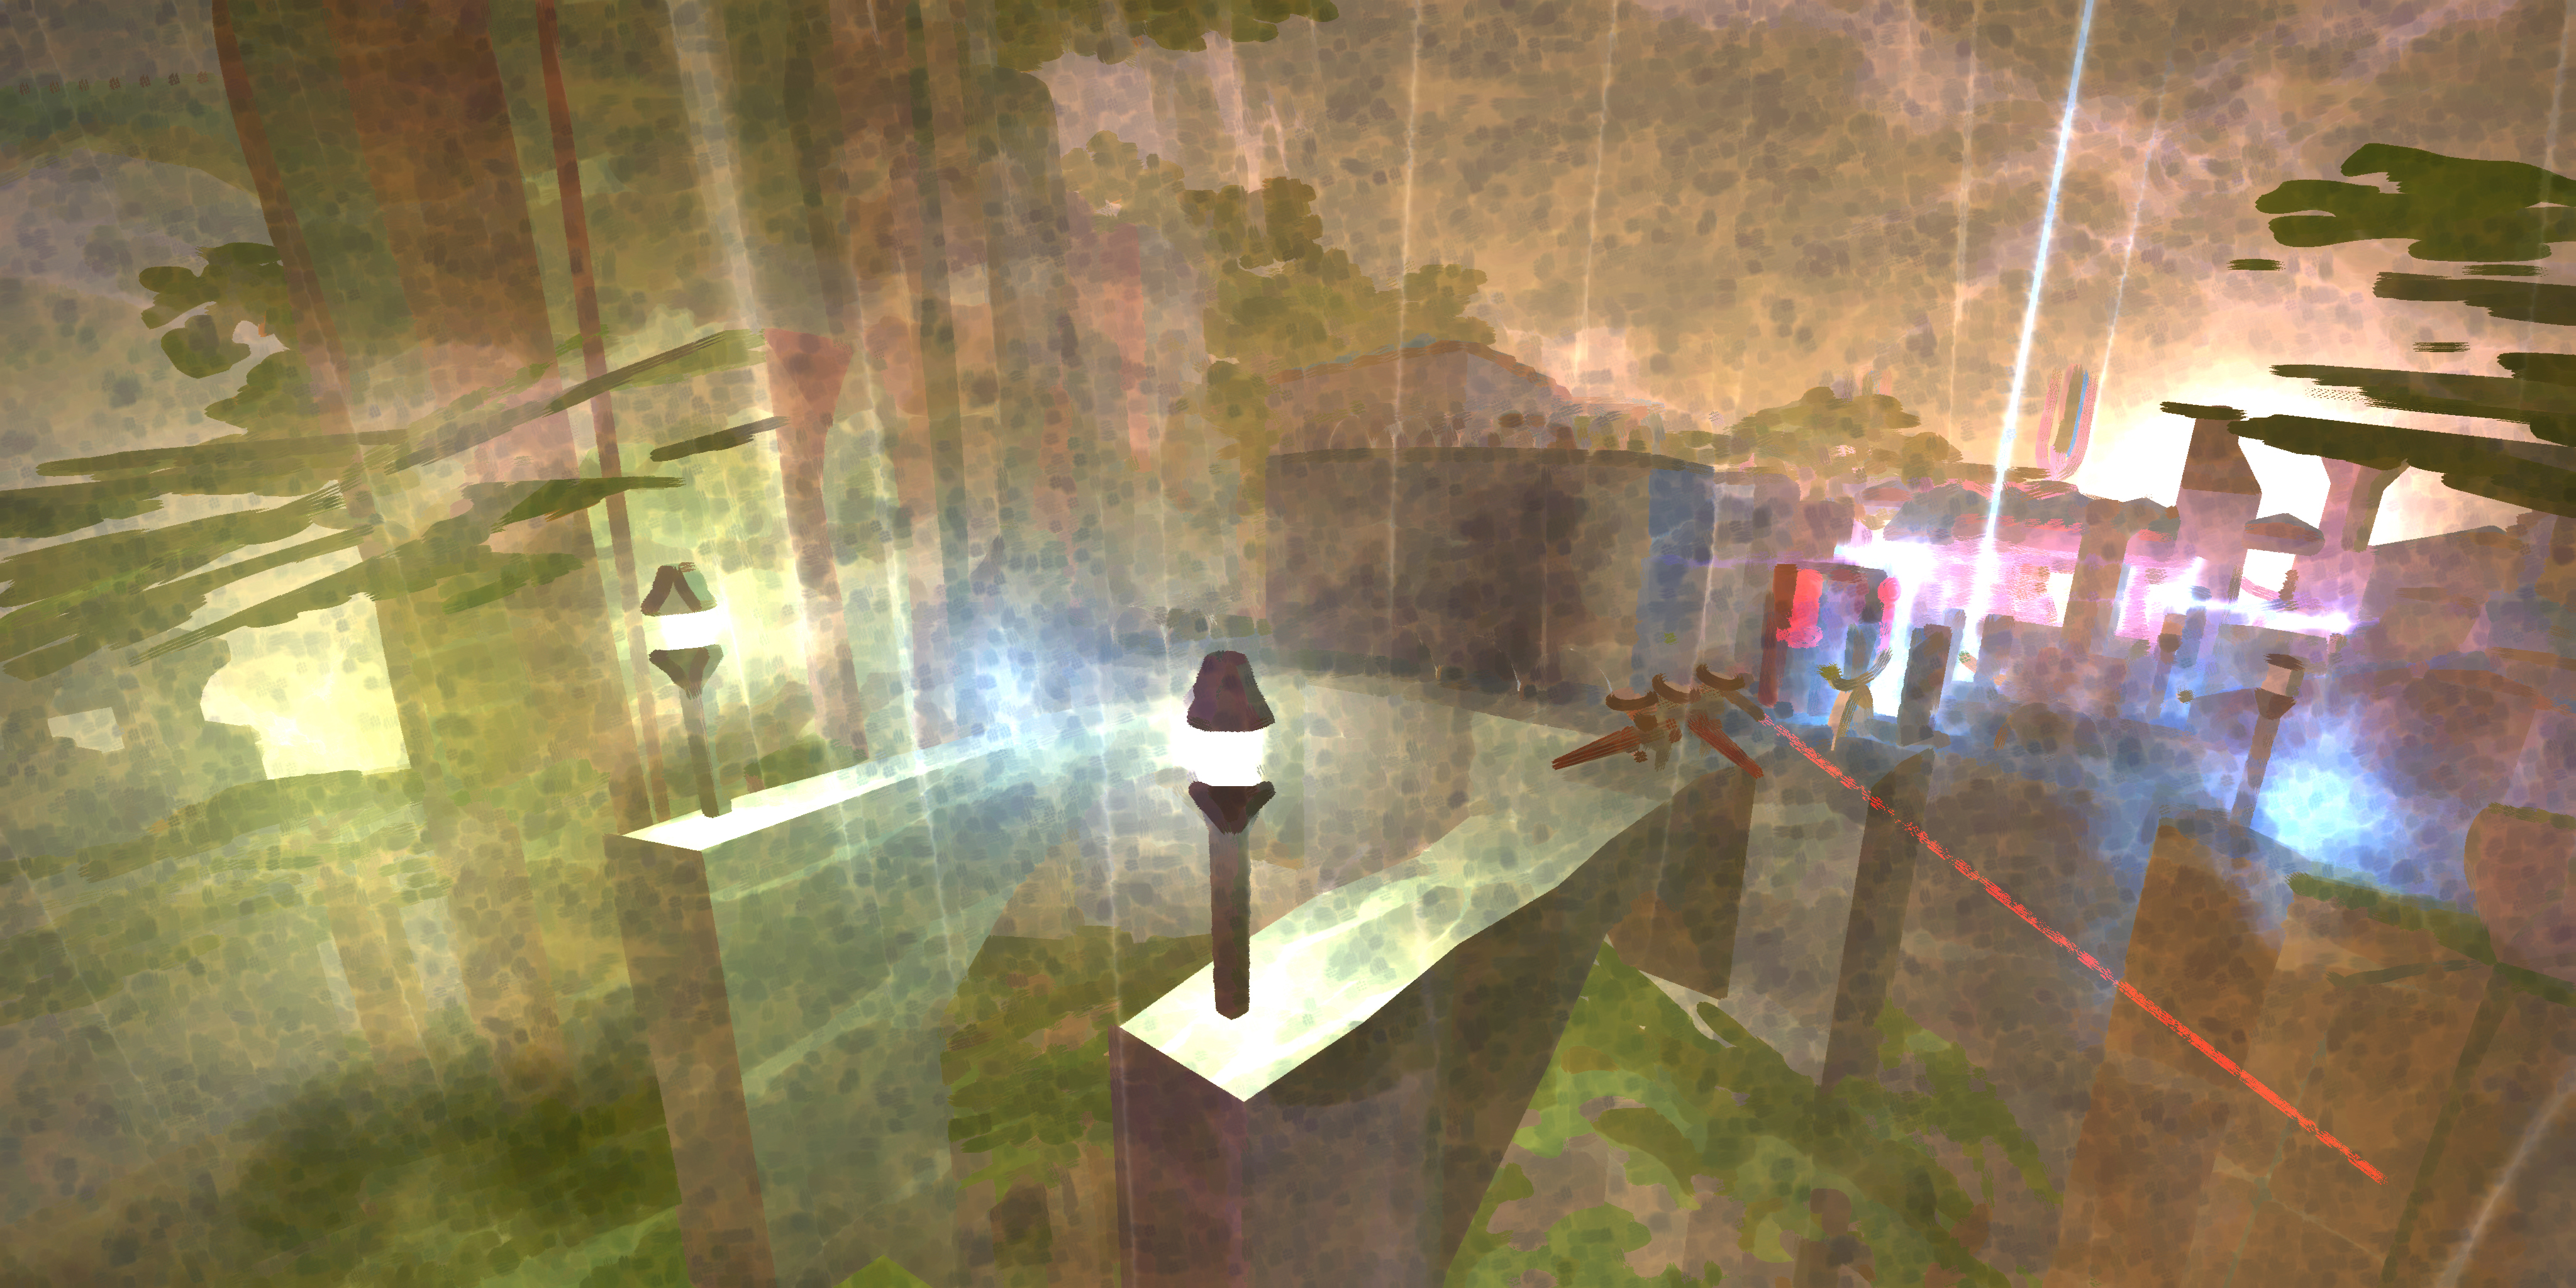
Probably the best way I could describe the game Love is to compare it to Minecraft, although that would be short-selling it greatly. Made by Eskil Steenberg, the game is for the most part entirely procedurally generated, down to the animations. It is an MMO where the gameplay is primarily cooperative – players seek to work together to defeat enemies and build settlements, and in addition there are AI groups to interact with as you see fit. It differs from Minecraft in aesthetic considerations, certainly. It’s freaking beautiful. Go play it.

http://www.quelsolaar.com/love/video.html

Sam

30 Jan 2013

OrgOrgChart (Justin Matejka)

OrgOrgChart visualizes the growth and restructing of an organization as a circular tree, charting the movements of employees into, out of, and through the company. I find particularly compelling the elastic motions of the tree as changes are made, which, combined with the cellular appearance of the graphic, really communicates the story of the organization as an organism, rather than the stiff bureaucracy traditionally associated with an organizational hierarchy chart. The project currently only maps data from AutoDesk, where it was developed, but it would be interesting to see an entire industry presented in this way, and watch the flow of personnel and the cycles of many different companies alongside each other. This project reminds me of a project I wrote about earlier, gource, which produces a similar tree-based animation of source control repositories, with a similarly-surprising organic feel.

On the Origin of Species: The Preservation of Favoured Traces (Ben Fry)

benfry_traces

In Traces, Ben Fry presents the evolution of evolution, diagramming the editing made to Darwin’s The Origin of Species as it progressed from the first to sixth addition, over a span of 14 years. The degree of detail in the dataset is what blows me away for this project, considering that the records of Darwin’s drafts are from the late 19th century, and yet we are able to see small changes of even only a few words as they were worked into the text by Darwin. Interestingly, with the rise of Google Docs and version tracking in a variety of forms, we are almost at a point where a visualization like this could be easily generated for any work, even as it is being created.

STYN (Sam van Doorn)

svd_styn

STYN traces the path of a pinball through the pinball machine surface simply by applying paint to the ball and letting the trail evolve. This project stands out from the others because it doesn’t rely on fancy computer transformations of the data; everything is generated simply by playing the pinball game. Because of this, anybody can walk up and be directly involved in creating the visualization, as opposed to the passive, after-the-fact involvement in other projects. One component that I feel is missing from the documentation of this project is video of the tracings actually being produced, somewhat like the iQ Font project shown during lecture. This would add another dimension to the visualization, showing its evolution through time.

Ziyun

30 Jan 2013

{20Hz} – by Semiconductor ( Ruth Jarman and Joe Gerhardt )

CARISMA (Canadian Array for Realtime Investigations of Magnetic Activity)

Visualizing the immaterials and invisibles is a fascinating topic. This project turns an scientific data, a radio array captured at 20Hz into audio – “the tweeting and rumbles caused by incoming solar wind”, “a geo-magnetic storm occurring in the Earth’s upper atmosphere”.

They did both data sonification ( which interests me a lot) and sound visualization beautifully.

And the universe, universe, universe…


{Getting Lost} – by Marco Bagni

Not much to do with information, but very very eye-catching “infographically-stylized” animations.


{MTA.me} – by Alexander Chen

An old project in 2011, visualizing the NYC subway system into interactive musical instrument. Turning lines ( the subway routes) to strings is a very intuitive musical thinking. Simple idea but was very nicely done. And I can watch the lines growing for hours..

Kyna

30 Jan 2013

His and Hers Colors by Stephen Von Worley

his&hers

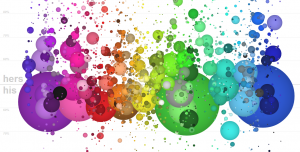
This piece utilizes a colorful and playful aesthetic to present information gathered from a survey about colors. Men and women selected colors that appeal most to them, and then those colors were graphed according to gender, with the amount of people who preferred the color indicating the size of its representative sphere, and its location being indicative of the gender preference. From the layout it becomes obvious that women tend to prefer a larger variety of colors with longer names whereas men prefer simpler colors, or those with shorter, earthier names.

Foodmood by Affect Lab, Jana + Koos, and Ai Applied

foodmood

Foodmood is an interactive site that scrapes Twitter for tweets about food and the mood of the tweet, and compiles this information by country. The end result is a representation of a country’s attitude towards a food at any given time. The countries themselves can be sorted by income, weight, or selected individually. The site utilizes a simple, easy-to-understand aesthetic when presenting this multitude of information, which makes side-by-side comparison of countries easy.

Wind Map by Hint.FM

windmap

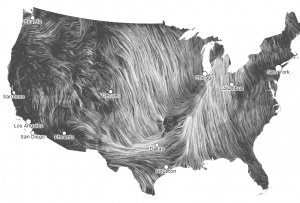
Wind Map is a simple concept with a visually stunning execution. The site scrapes information about wind speed and direction from the National Digital Forecast Database and uses it to map the flow of the wind across the country in real time. I especially like the flow in the west, where what would normally be straight smooth lines are curled and warped by the Rockies.