Keali-Visualization


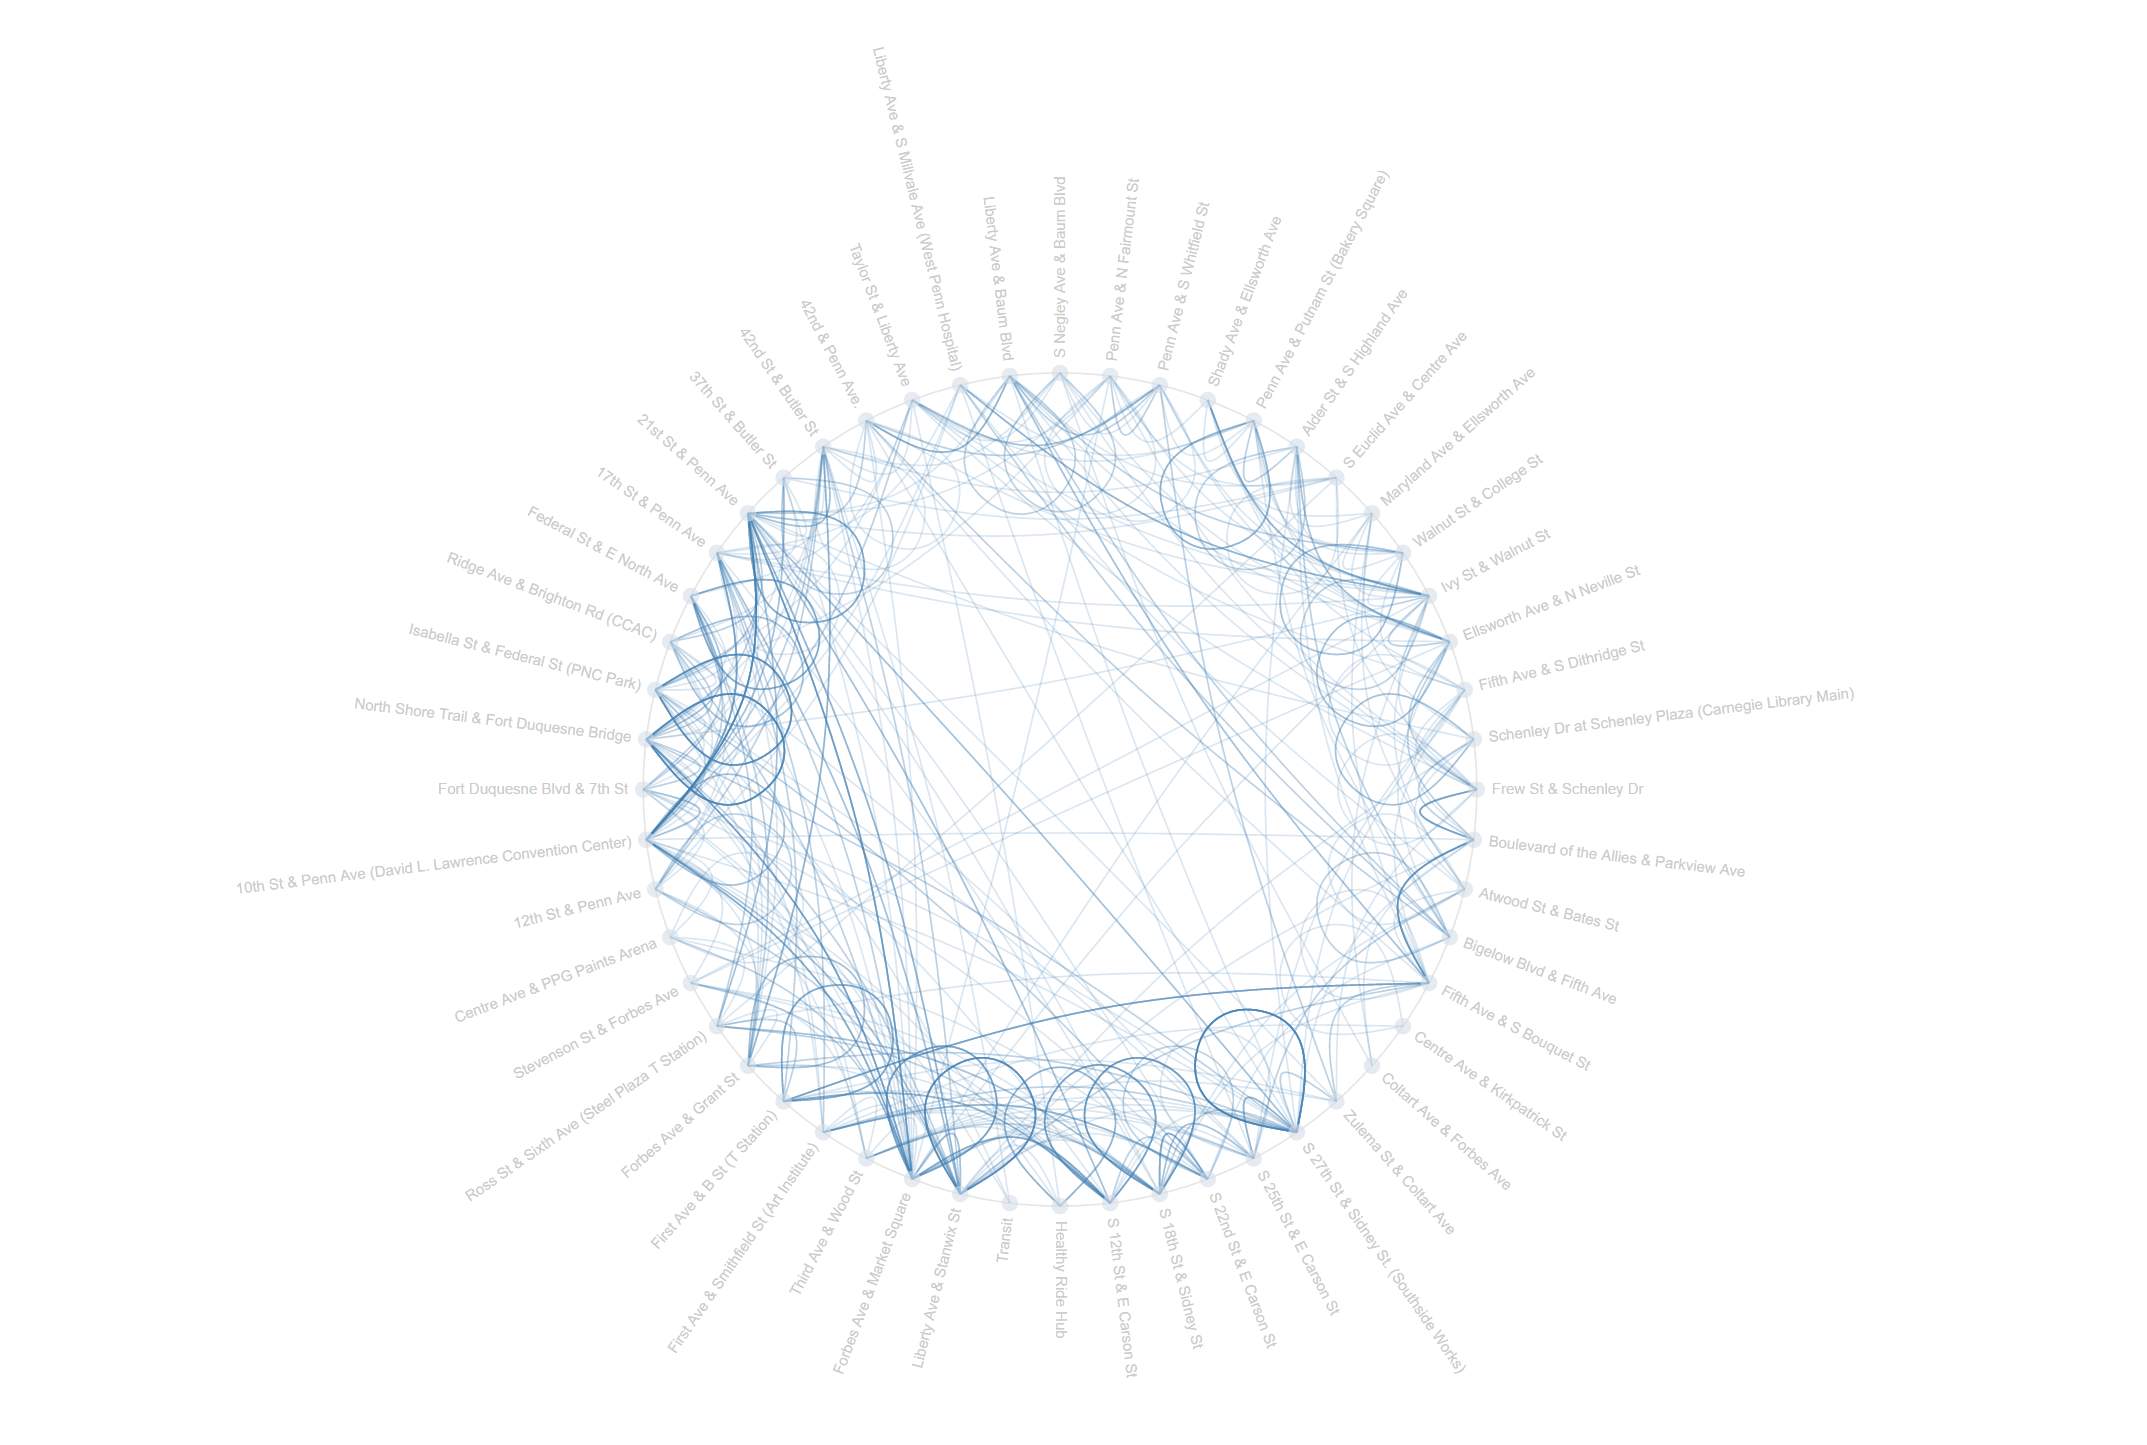
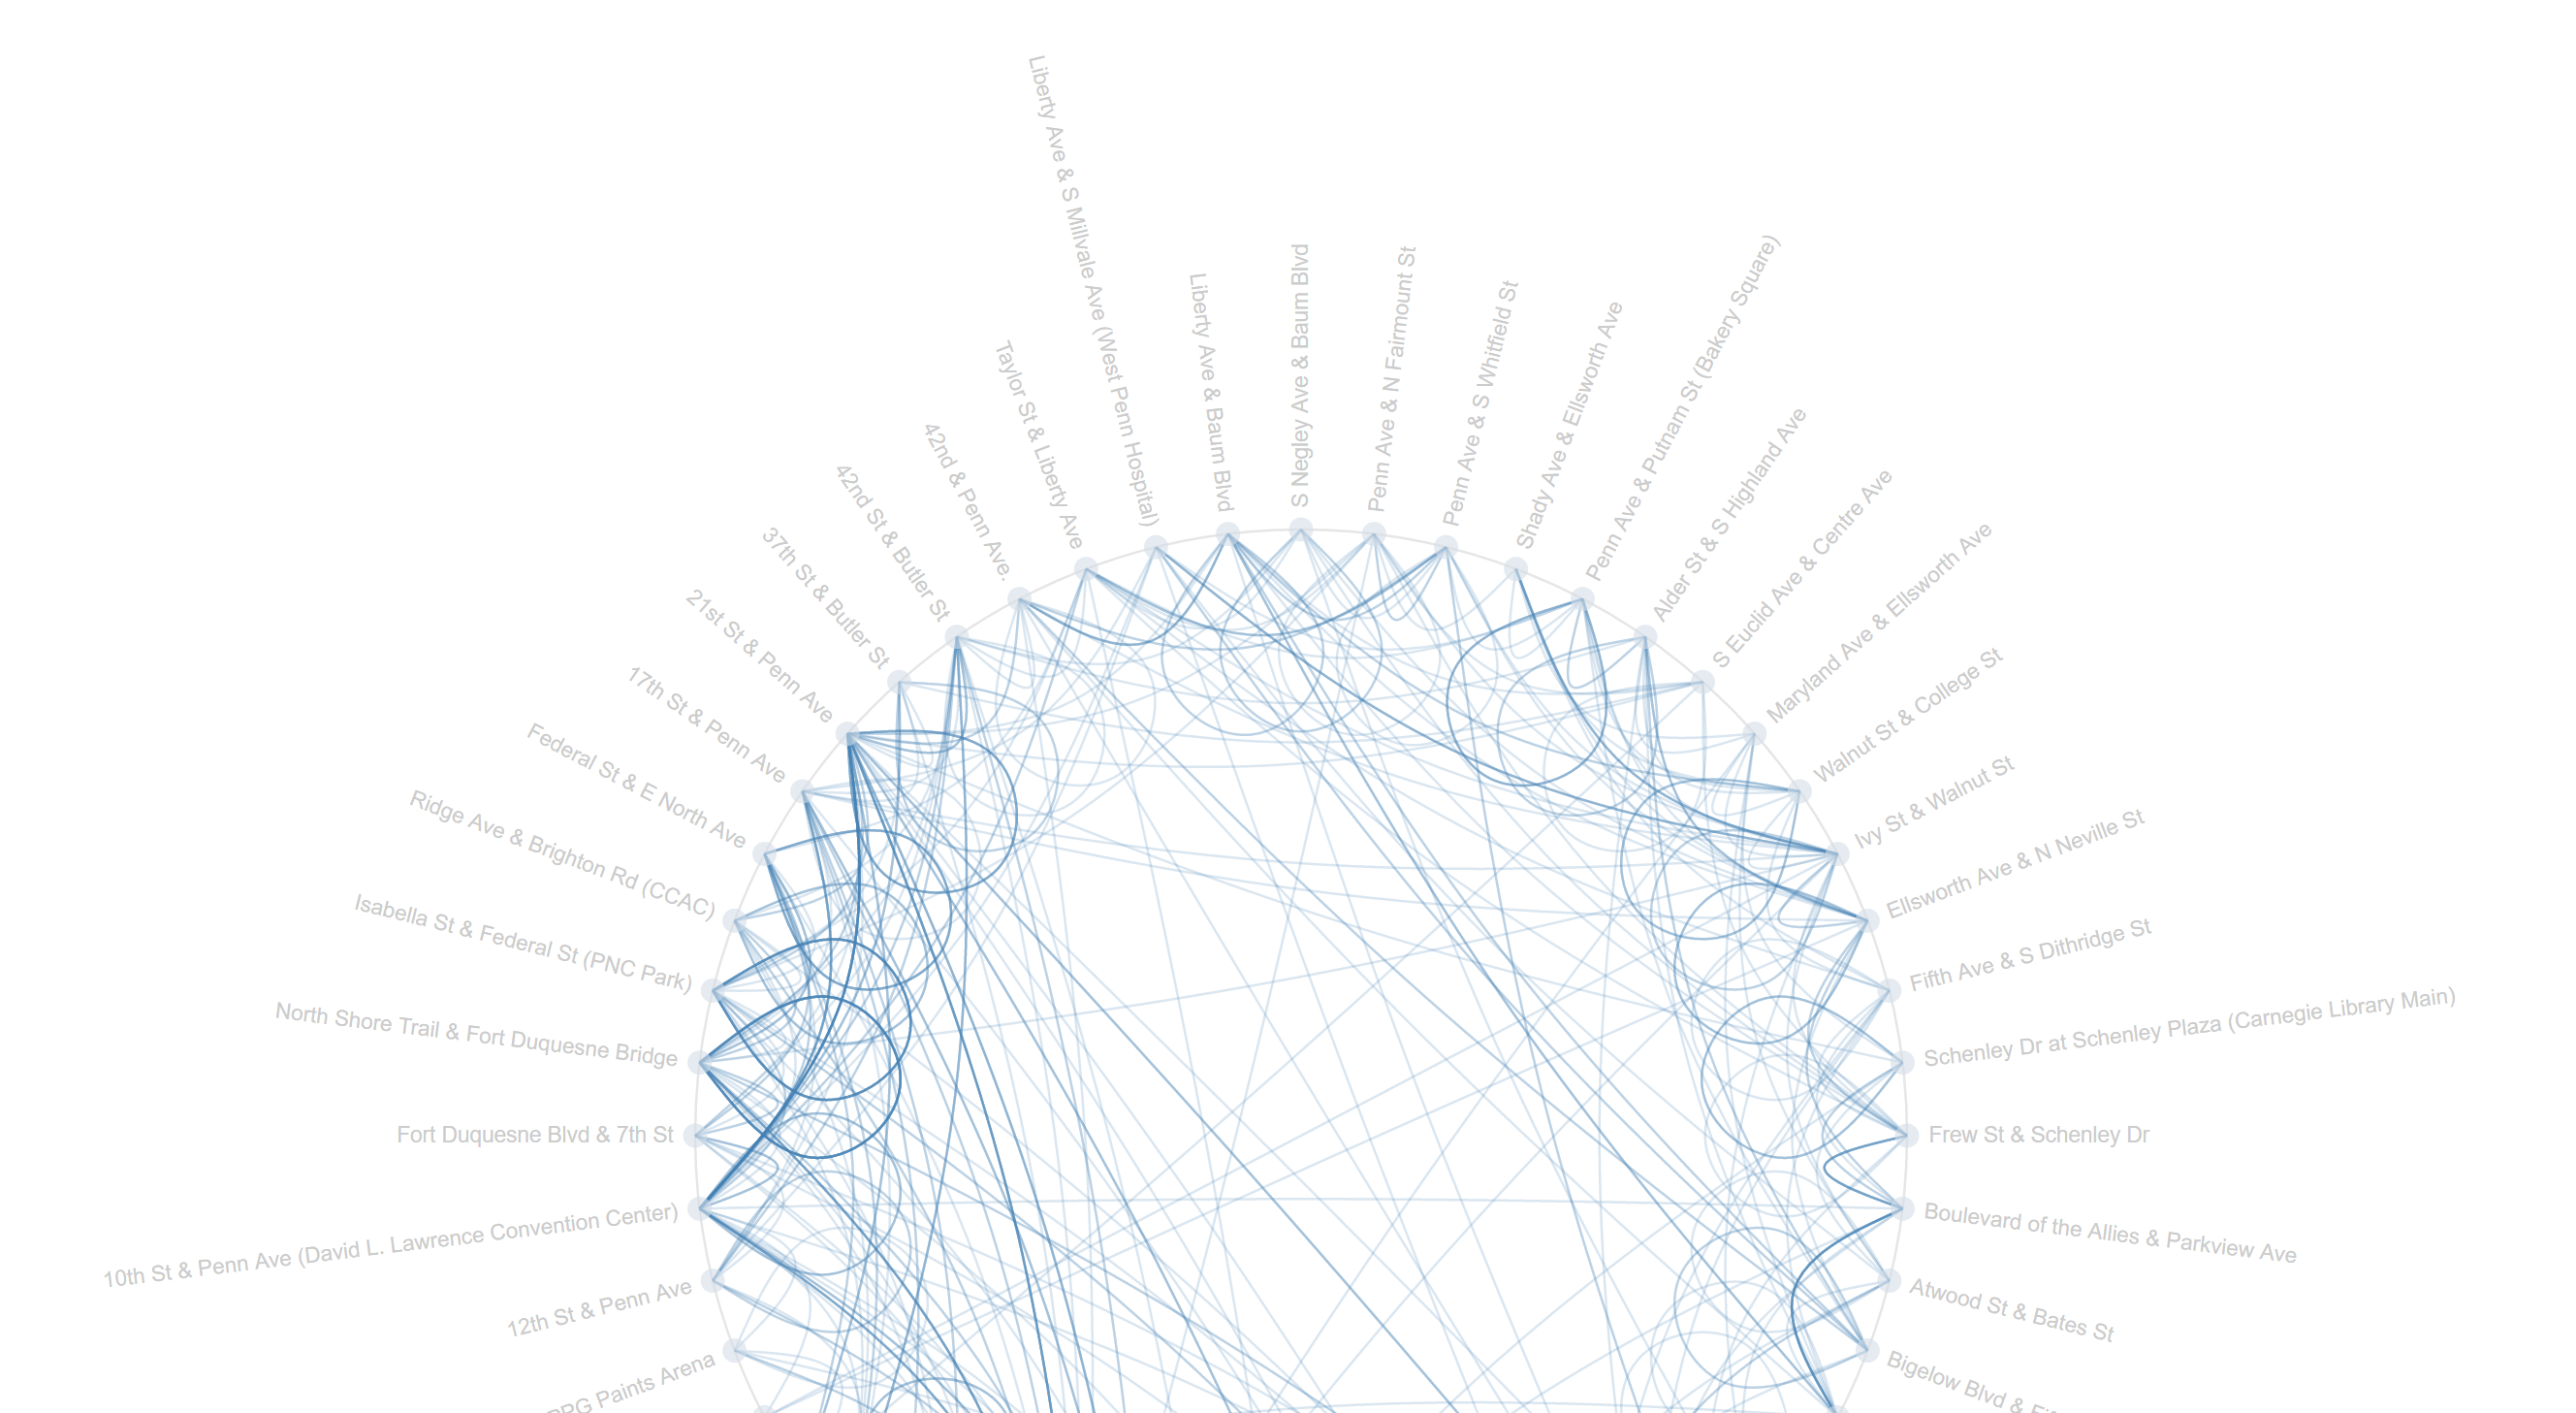
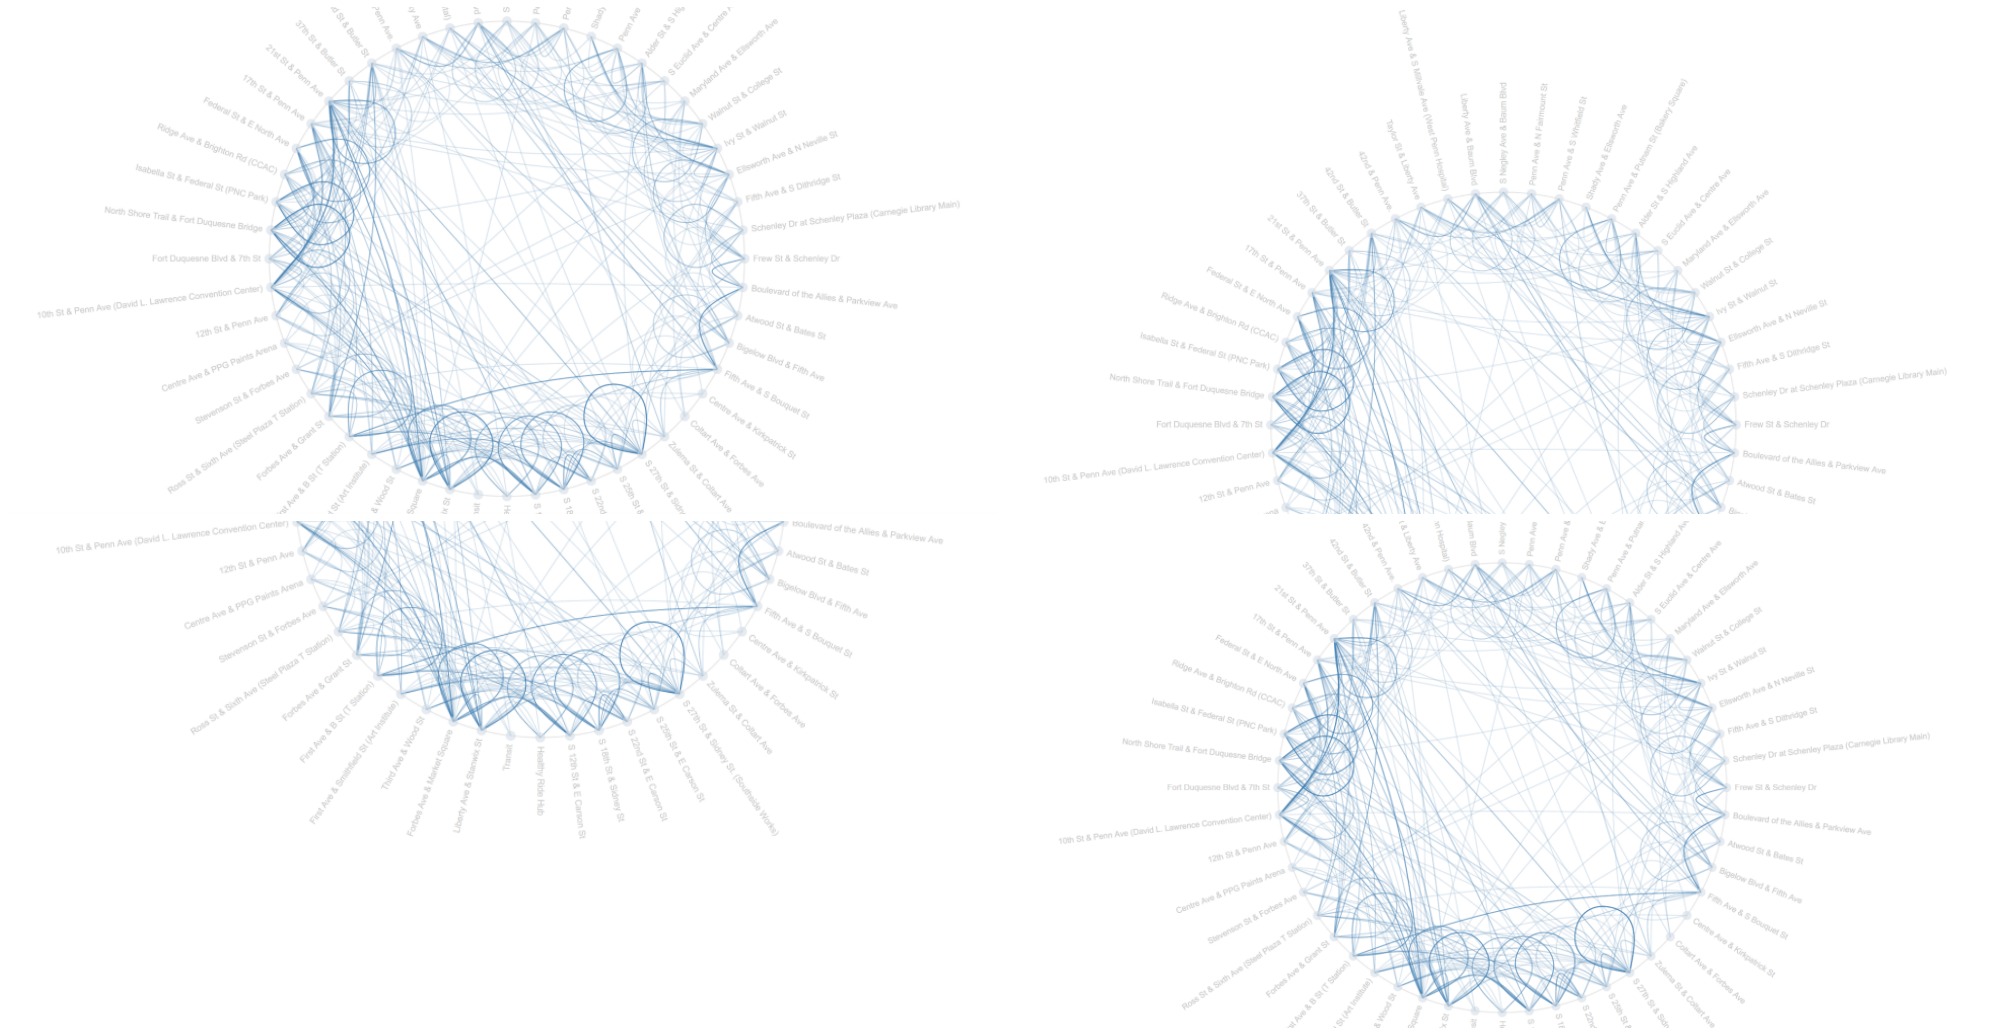
My visualization displayed the data arranged in a circle of all the stations recorded in the spreadsheet– and then connected the corresponding start stations with their end stations of each bike rented; as such each line represents the journey of one bike from one station to another, or from one station back to itself. (Otherwise seen as a loop in the visualization.) The customization of the lines being at a lower opacity allows for the concept of frequency in the diagram, so the darker, more often-overlapped, and more opaque lines imply that more instances of bikes traveling some path with those two stations as the destination endpoints.
Reference 1 | Reference 2 | Reference 3
I initially found this block appealing because I felt it balanced uniqueness in style as well as practicality and readability (at least, in general, not specifically picking out every single line…) I instinctively thought the only way to reasonably implement relevant data was to have the stations connect to one another, and I stayed on track to this idea. I originally practiced with a simple network graph example, and the results were barely readable because of the plethora of overlapping messes of lines; I then combined two other references to reformat the data as json with Python, mirroring the structure of the example’s json data by labeling nodes and links accordingly (I also originally placed dummy data at the nodes to figure out exactly how the code worked). I then dug through the code to find out exactly how much could be customized, and refined the node colors, opacities, edge colors, link widths, etc. to my liking. Frankly, I had the lowest expectations for this project as D3 was incredibly overwhelming, as well as even dealing with the data itself before I could even get into D3, so I am quite thankful for the results and just immensely relieved that I outputted something because I wanted to cry multiple times throughout the work process.

import csv
import json

bikeIDs = open('bikeids.txt', 'r').read()
ignore = 1
with open('data/HealthyRide Rentals 2016 Q3.csv', 'r') as csvfile:

    rentalReader = csv.reader(csvfile)
    output = []
    rawNodes = set()
    rawLinks = []
    stationNameDict = dict()
    useEvery = 50
    counter = 0
    for row in rentalReader:
        counter += 1
        if (counter % useEvery != 0):
            continue
        ignore -= 1;
        if (ignore >= 0):
            continue
        try:
            start = int(row[5])
            startName = row[6]
            end = int(row[7])
            endName = row[8]
            stationNameDict[start] = startName
            stationNameDict[end] = endName
            rawNodes.add(start)
            rawNodes.add(end)
            rawLinks.append((start,end))
        except:
            pass
    nodes = []
    links = []
    rawNodes = list(rawNodes)
    indices = dict()
    for rawNode in rawNodes:
        name = stationNameDict[rawNode]
        group = rawNode
        nodes.append({"name":name, "group": rawNode})
    for i in range(len(rawNodes)):
       stationId = rawNodes[i]
       indices[stationId] = i
    for (startId, endId) in rawLinks:
        source = indices[startId]
        target = indices[endId]
        sourceName = stationNameDict[startId]
        endName = stationNameDict[endId]
        weight = 1
        links.append({"source":sourceName, "target":endName, "weight":weight})
    output = {"nodes": nodes, "links":links}

    with open("graphFile.json","w") as outfile:
        outfile.write(json.dumps(output))

def getStations():
    pass