Jaqaur – Visualization
All right, all right. This is not my best work. However, it was really interesting to get to work with D3 for the first time, and I’m glad I know a bit more about it now.
My plan was to map trips from every bike stop to every other bike stop in a chord diagram. I chose a chord diagram because I thought it reminded me of a wheel, and I thought “Hey, maybe I can make it spin, or decorate it to look like a wheel!” That all went out the window very soon.
I used a chord diagram from the D3 blocks website to achieve this, and honestly changed very little about it except for the colors, the scale of the little marks around the circle, and of course the data. The main code that I wrote was the Processing file that turned the data in the .csv file we had into data I could work with. It created a two dimensional array, then incremented elements (A, B) and (B, A) by one for every trip from station A to B, or station B to A. I chose to make the matrix symmetrical, and treat trips from A to B as equivalent to trips from B to A. Perhaps the other way may have been a bit more precise, but it also made the diagram even less readable. When the chords were thicker at one end than another, I didn’t really know what that meant, so I wanted to just keep the matrix symmetrical.
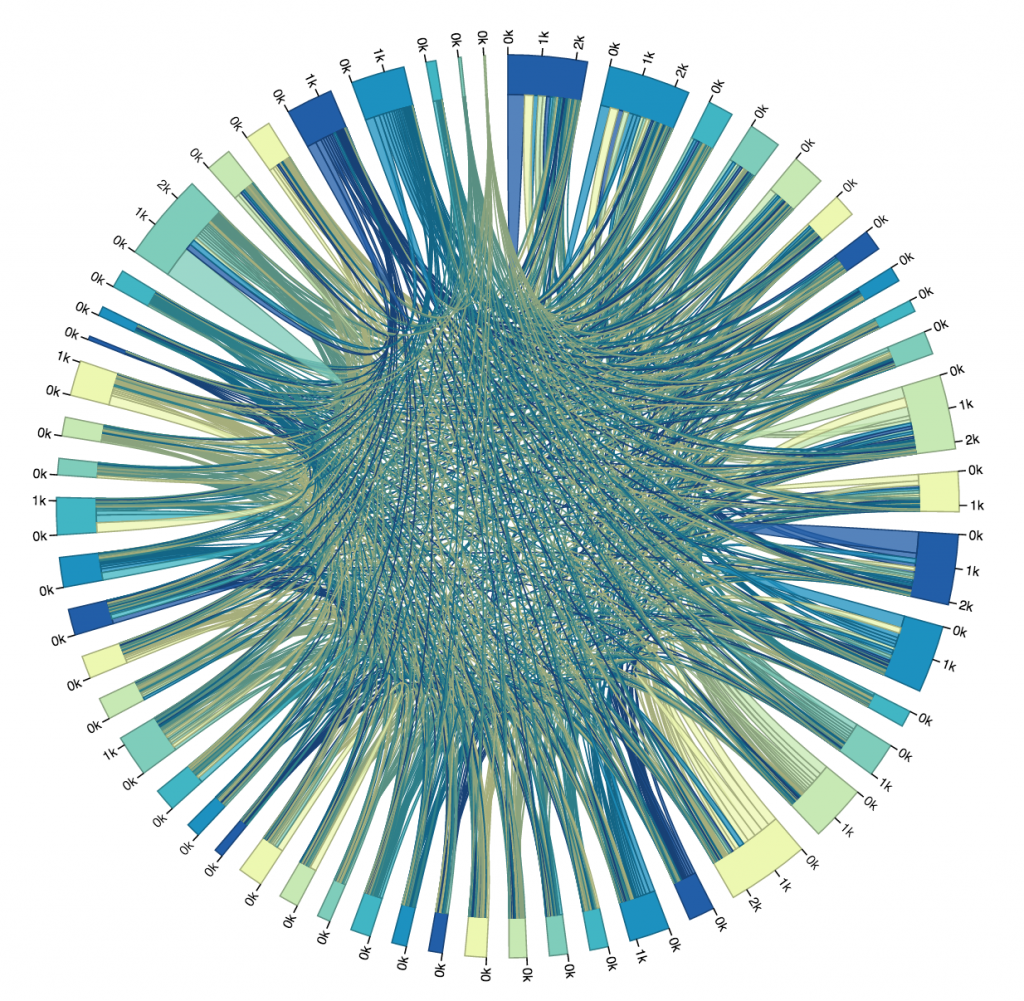
The Processing file generated a .txt file containing the matrix that I needed. After I generated it, I pasted it into the D3 in my HTML file, and then I displayed it as a graphic. It all went according to plan (I guess), but I hadn’t really thought about just how unrealistic it was to make a chord diagram of over fifty bike stops. As you can see in the image below, it was pretty much totally unreadable and unhelpful.

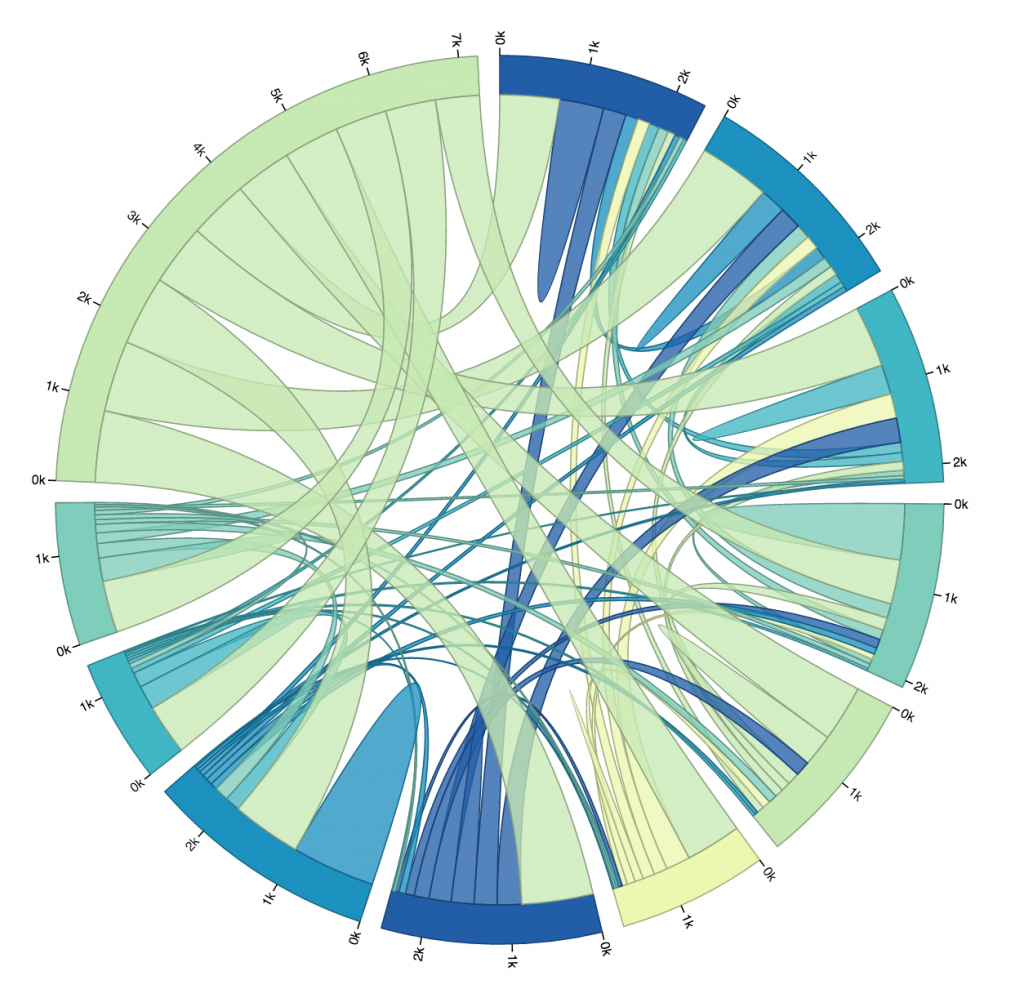
So, I looked at that first trial, picked out the ten busiest stops (I did this manually, not by writing code, just for time’s sake), and altered my code so that I could get a new matrix that only dealt with the ride data for the top ten busiest stops. You can see that iteration below. The eleventh, largest section of the circle in the upper left is the “other” section, representing rides from one of the ten busiest stations to or from one of the less busy stations. I chose to not display rides from “other” to “other,” because it wasn’t relevant to the ten busiest stops, and it dominated the circle when it was included.

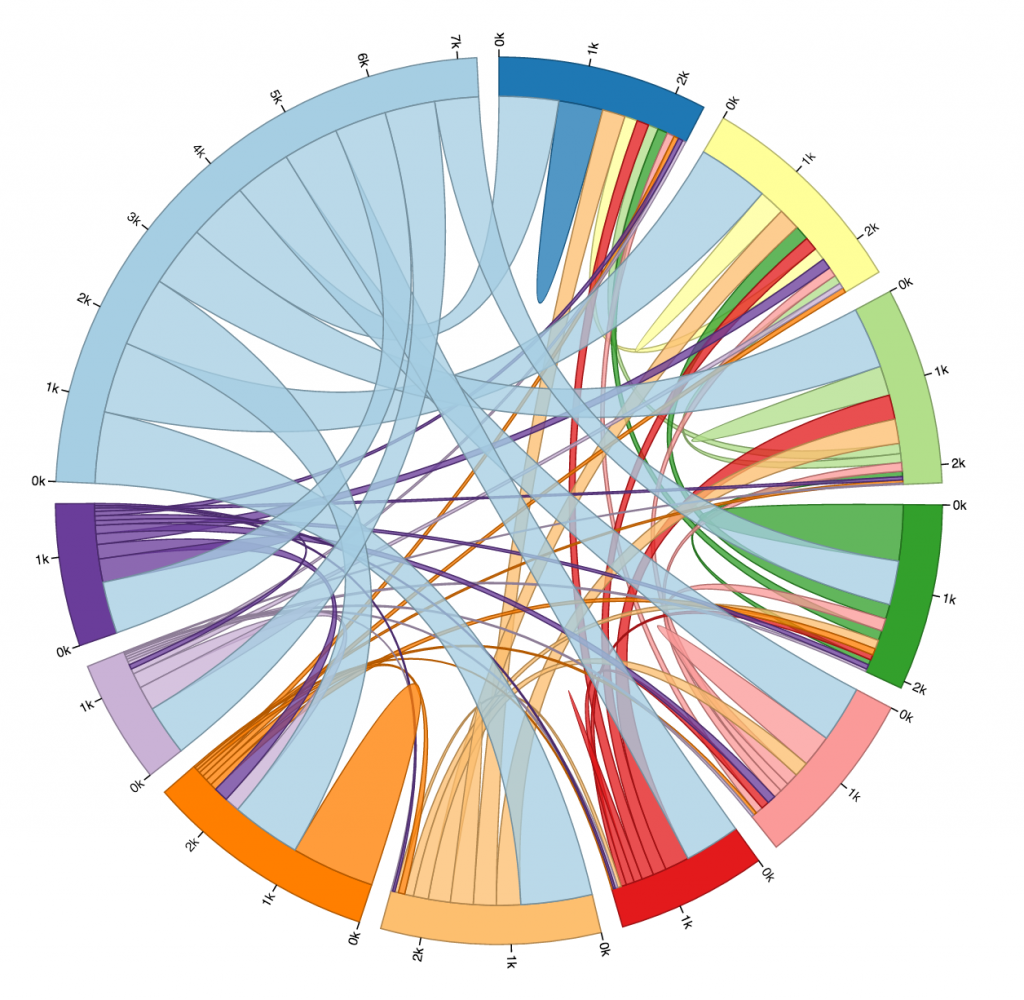
Here is another diagram representing the same data, just with a different color scheme. I don’t find this one as pretty, but it gives every stop its own unique color, which makes it slightly more readable. As you can see, every stop’s connectors are ordered from largest to smallest (going clockwise).
One thing I found quite interesting is how none of the ten busiest stops’ largest connector was to another one of the ten busiest stops. Most of them had the most rides to or from “other,” which is to be expected, I supposed, considering just how many other stations there are. Still, several of the stops have more rides to themselves than any other stop, more even than to all of the “other” stops! And a lot of the stops whose largest connector was to “other” still had more rides to themselves than to any of the other ten busiest stops.
I was surprised to see how common that was. I guess it isn’t all that weird to check out a bike for a while, ride it around for fun or for errands, and then bring it back where you found it without putting it away in between. Still, if I were to visualize more data I would like to look exclusively at rides that start and end in the same place, and see if there is any pattern there regarding the type of user that does this, or the time of day it is done.

All in all, this is a very very minimum viable product. I spent most of the week just struggling with D3, and while time constraints are no real excuse for poor work, I would like the record to reflect that I am very aware that this project is flawed. My biggest frustration is that the names of the stops in question are not displayed by the portion of the circle that represents them. I could’t figure out how to do that, but if I were to work more on this visualization, that would be my next priority.
Here’s a link to my code on github: https://github.com/JacquiwithaQ/60212/tree/master/Bike%20Data%20Visualization
Here is my Processing code for the version that only cares about the ten busiest stops:
int[][] matrix;
Table allRidesTable;

PrintWriter output;

void makeMatrix(){
  matrix = new int[11][11];
  for (int i=0; i<11; i++){
    for (int j=0; j<11; j++){
      matrix[i][j] = 0;
    }
  }
  //Now our matrix is set up, but it's all zero. Now we need to fill it with values.
  allRidesTable = loadTable("HealthyRide Rentals 2016 Q3.csv", "header");
  //Trip iD,Starttime,Stoptime,Bikeid,Tipduration,From station id, From station name,To station id,To station name, Usertype
  int totalRides = allRidesTable.getRowCount();
  for (int row=0; row < totalRides; row++){
    TableRow thisRow = allRidesTable.getRow(row);
    int startStationID = thisRow.getInt("From station id");
    int endStationID = thisRow.getInt("To station id");
    println("Start ID = " + startStationID + ", End ID = " + endStationID);
    //We only want to map the 10 busiest stations, which are:
    //1000, 1001, 1010, 1012, 1013, 1016, 1017, 1045, 1048, 1049
    int startStationNumber= 10;
    int endStationNumber = 10;
    if (startStationID==1000) startStationNumber = 0;
    if (startStationID==1001) startStationNumber = 1;
    if (startStationID==1010) startStationNumber = 2;
    if (startStationID==1012) startStationNumber = 3;
    if (startStationID==1013) startStationNumber = 4;
    if (startStationID==1016) startStationNumber = 5;
    if (startStationID==1017) startStationNumber = 6;
    if (startStationID==1045) startStationNumber = 7;
    if (startStationID==1048) startStationNumber = 8;
    if (startStationID==1049) startStationNumber = 9;
    if (endStationID==1000) endStationNumber = 0;
    if (endStationID==1001) endStationNumber = 1;
    if (endStationID==1010) endStationNumber = 2;
    if (endStationID==1012) endStationNumber = 3;
    if (endStationID==1013) endStationNumber = 4;
    if (endStationID==1016) endStationNumber = 5;
    if (endStationID==1017) endStationNumber = 6;
    if (endStationID==1045) endStationNumber = 7;
    if (endStationID==1048) endStationNumber = 8;
    if (endStationID==1049) endStationNumber = 9;
    //println("Start Number = " + startStationNumber + ", End Number = " + endStationNumber);
    if (startStationNumber == endStationNumber){
      matrix[startStationNumber][endStationNumber] += 1;
    } else {
      //I will treat trips from station A->B and B->A as the same.
      //Direction does not matter for this data visualization.
      //So, the matrix will be symmetric.
      matrix[startStationNumber][endStationNumber] += 1;
      matrix[endStationNumber][startStationNumber] += 1;
    }
  }
  //Now the matrix is full of the number of rides from place to place.
}

void setup() {
  makeMatrix();
  output = createWriter("myMatrix.txt");
  int nRows = matrix.length;
  int nCols = nRows;

  output.println("[");
  for (int row = 0; row < nRows; row++) {
    String aRowString = "[";
    for (int col = 0; col< nCols; col++) {
      aRowString += matrix[row][col];
      if (col != (nCols -1)){
        aRowString += ", ";
      }
    }
    aRowString += "]";
    if (row != (nRows -1)) {
      aRowString += ", ";
    }
    output.println(aRowString);
  }
  output.println("];");


  output.flush();  // Writes the remaining data to the file
  output.close();  // Finishes the file
  exit();  // Stops the program
}
And here is my Processing Code for the version that maps all stops:
int[][] matrix;
Table allRidesTable;

PrintWriter output;

void makeMatrix(){
  matrix = new int[53][53];
  for (int i=0; i<53; i++){
    for (int j=0; j<53; j++){
      matrix[i][j] = 0;
    }
  }
  //Now our matrix is set up, but it's all zero. Now we need to fill it with values.
  allRidesTable = loadTable("HealthyRide Rentals 2016 Q3.csv", "header");
  //Trip iD,Starttime,Stoptime,Bikeid,Tipduration,From station id, From station name,To station id,To station name, Usertype
  int totalRides = allRidesTable.getRowCount();
  for (int row=0; row < totalRides; row++){
    TableRow thisRow = allRidesTable.getRow(row);
    int startStationID = thisRow.getInt("From station id");
    int endStationID = thisRow.getInt("To station id");
    println("Start ID = " + startStationID + ", End ID = " + endStationID);
    //Note that the station IDs range from 1000 to 1051, inclusive
    int startStationNumber = startStationID - 1000;
    int endStationNumber = endStationID - 1000;
    if (startStationNumber < 0 || startStationNumber > 51){
      //The Start Station number was invalid, and all invalid Stations will be called 52.
      startStationNumber = 52;
    }
    if (endStationNumber < 0 || endStationNumber > 51){
      //The End Station number was invalid, and all invalid Stations will be called 52.
      endStationNumber = 52;
    }
    println("Start Number = " + startStationNumber + ", End Number = " + endStationNumber);
    if (startStationNumber == endStationNumber){
      matrix[startStationNumber][endStationNumber] += 1;
    } else {
      //I will treat trips from station A->B and B->A as the same.
      //Direction does not matter for this data visualization.
      //So, the matrix will be symmetric.
      matrix[startStationNumber][endStationNumber] += 1;
      matrix[endStationNumber][startStationNumber] += 1;
    }
  }
  //Now the matrix is full of the number of rides from place to place.
}

void setup() {
  makeMatrix();
  output = createWriter("myMatrix.txt");
  int nRows = matrix.length;
  int nCols = nRows;

  output.println("[");
  for (int row = 0; row < nRows; row++) {
    String aRowString = "[";
    for (int col = 0; col< nCols; col++) {
      aRowString += matrix[row][col];
      if (col != (nCols -1)){
        aRowString += ", ";
      }
    }
    aRowString += "]";
    if (row != (nRows -1)) {
      aRowString += ", ";
    }
    output.println(aRowString);
  }
  output.println("];");


  output.flush();  // Writes the remaining data to the file
  output.close();  // Finishes the file
  exit();  // Stops the program
}
And here is my HTMl/D3: