cambu-visualization
click (on image) for interactive version
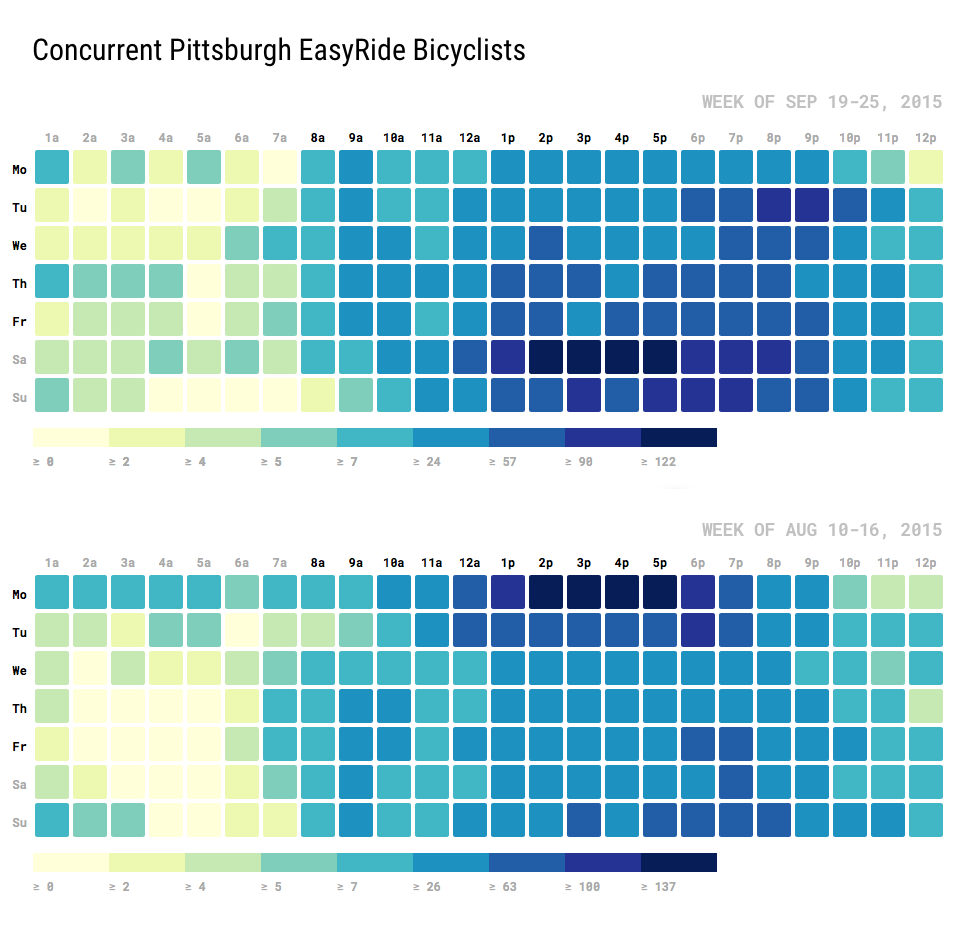
For this project, I decided to analyze the number of concurrent bicyclists using the EasyRide system at any one moment in time. To visualize this, I used Tom May’s Day/Hour Heatmap.
Table allTimes;
IntDict grid; //thanks to gautam for the idea of an intdict
String gridKey;

//"this is about you having a car crash with D3" ~Golan

void setup() {
  // change this if you add a new file
  int dayOfMonthStarting = 7;
  grid = new IntDict();

  //allTimes = loadTable("startStopTimes_sep19to25.csv", "header");
  allTimes = loadTable("startStopTimes_aug10to16.csv", "header");

  //header is Starttime, Stoptime

  int numRows = allTimes.getRowCount();
  for (int i = 0; i < numRows; i++) { TableRow curRow = allTimes.getRow(i); //M/D/YEAR 24HR:60MIN //PARAM ON START HOUR String startTime = curRow.getString("Starttime"); String Str = startTime; int startChar = Str.lastIndexOf( ' ' ); int endChar = Str.lastIndexOf( ':' ); int startHourInt = Integer.parseInt(startTime.substring(startChar+1, endChar)); //PARAM ON END HOUR String stopTime = curRow.getString("Stoptime"); //9/19/2015 0:01 String StrR = stopTime; int startCharR = StrR.lastIndexOf( ' ' ); int endCharR = StrR.lastIndexOf( ':' ); int stopHourInt = Integer.parseInt(stopTime.substring(startCharR+1, endCharR)); //PARAM ON DAY int curDay = Integer.parseInt(startTime.substring(2, 4)) - (dayOfMonthStarting - 1); //1-7 println("-->> " + startTime + " to " + stopTime);
    //println("Place this in day: " + curDay + ", with an hour range of: ");
    //println("start hour: " + startHourInt);
    //println("stop hour: " + stopHourInt);

    int rideDur;

    if (startHourInt - stopHourInt == 0) {
      //place one hour of usage at the startHourInt location
      rideDur = 1;
      //println(rideDur);
    } else {
      rideDur = stopHourInt - startHourInt + 1;
      //println(rideDur);
      //d3_export(i);
    }
    startHourInt = startHourInt + 1;
    gridKey = "D" + curDay + "H" + startHourInt;
    println(gridKey + " -> " + rideDur);

    if (rideDur == 1) { //only incrementing or making a single hour change
      keyCreate(gridKey);
    } else { //ranged creation
      println(rideDur + " @ " + startHourInt);
      for (int n = startHourInt; n <= startHourInt + rideDur; n++) { gridKey = "D" + curDay + "H" + n; if (n > 24) {
          println("warning");
          //do nothing
        } else {
          keyCreate(gridKey);
        }

        println(n + " -> " + gridKey);
      }
    }
  }
  println(grid);
  d3_export();
}

void keyCreate(String gridKey) {
  if (grid.hasKey(gridKey) == true) {
    grid.increment(gridKey);
  } else {
    grid.set(gridKey, 1);
  }
}

void d3_export() {
  Table d3_data;
  d3_data = new Table();
  d3_data.addColumn("day");
  d3_data.addColumn("hour");
  d3_data.addColumn("value");

  for (int days = 1; days <= 7; days++) {
    for (int hours = 1; hours <= 24; hours++) {
      String keyComb ="D" + days + "H" + hours;
      //println(keyComb);
      TableRow newRow = d3_data.addRow();
      newRow.setInt("day", days);
      newRow.setInt("hour", hours);
      if (grid.hasKey(keyComb) == false) {
        newRow.setInt("value", 0);
      } else {
        newRow.setInt("value", grid.get(keyComb));
      }
    }
  }
  saveTable(d3_data, "data/sep7-13.tsv", "tsv");
}

