anson-Visualization
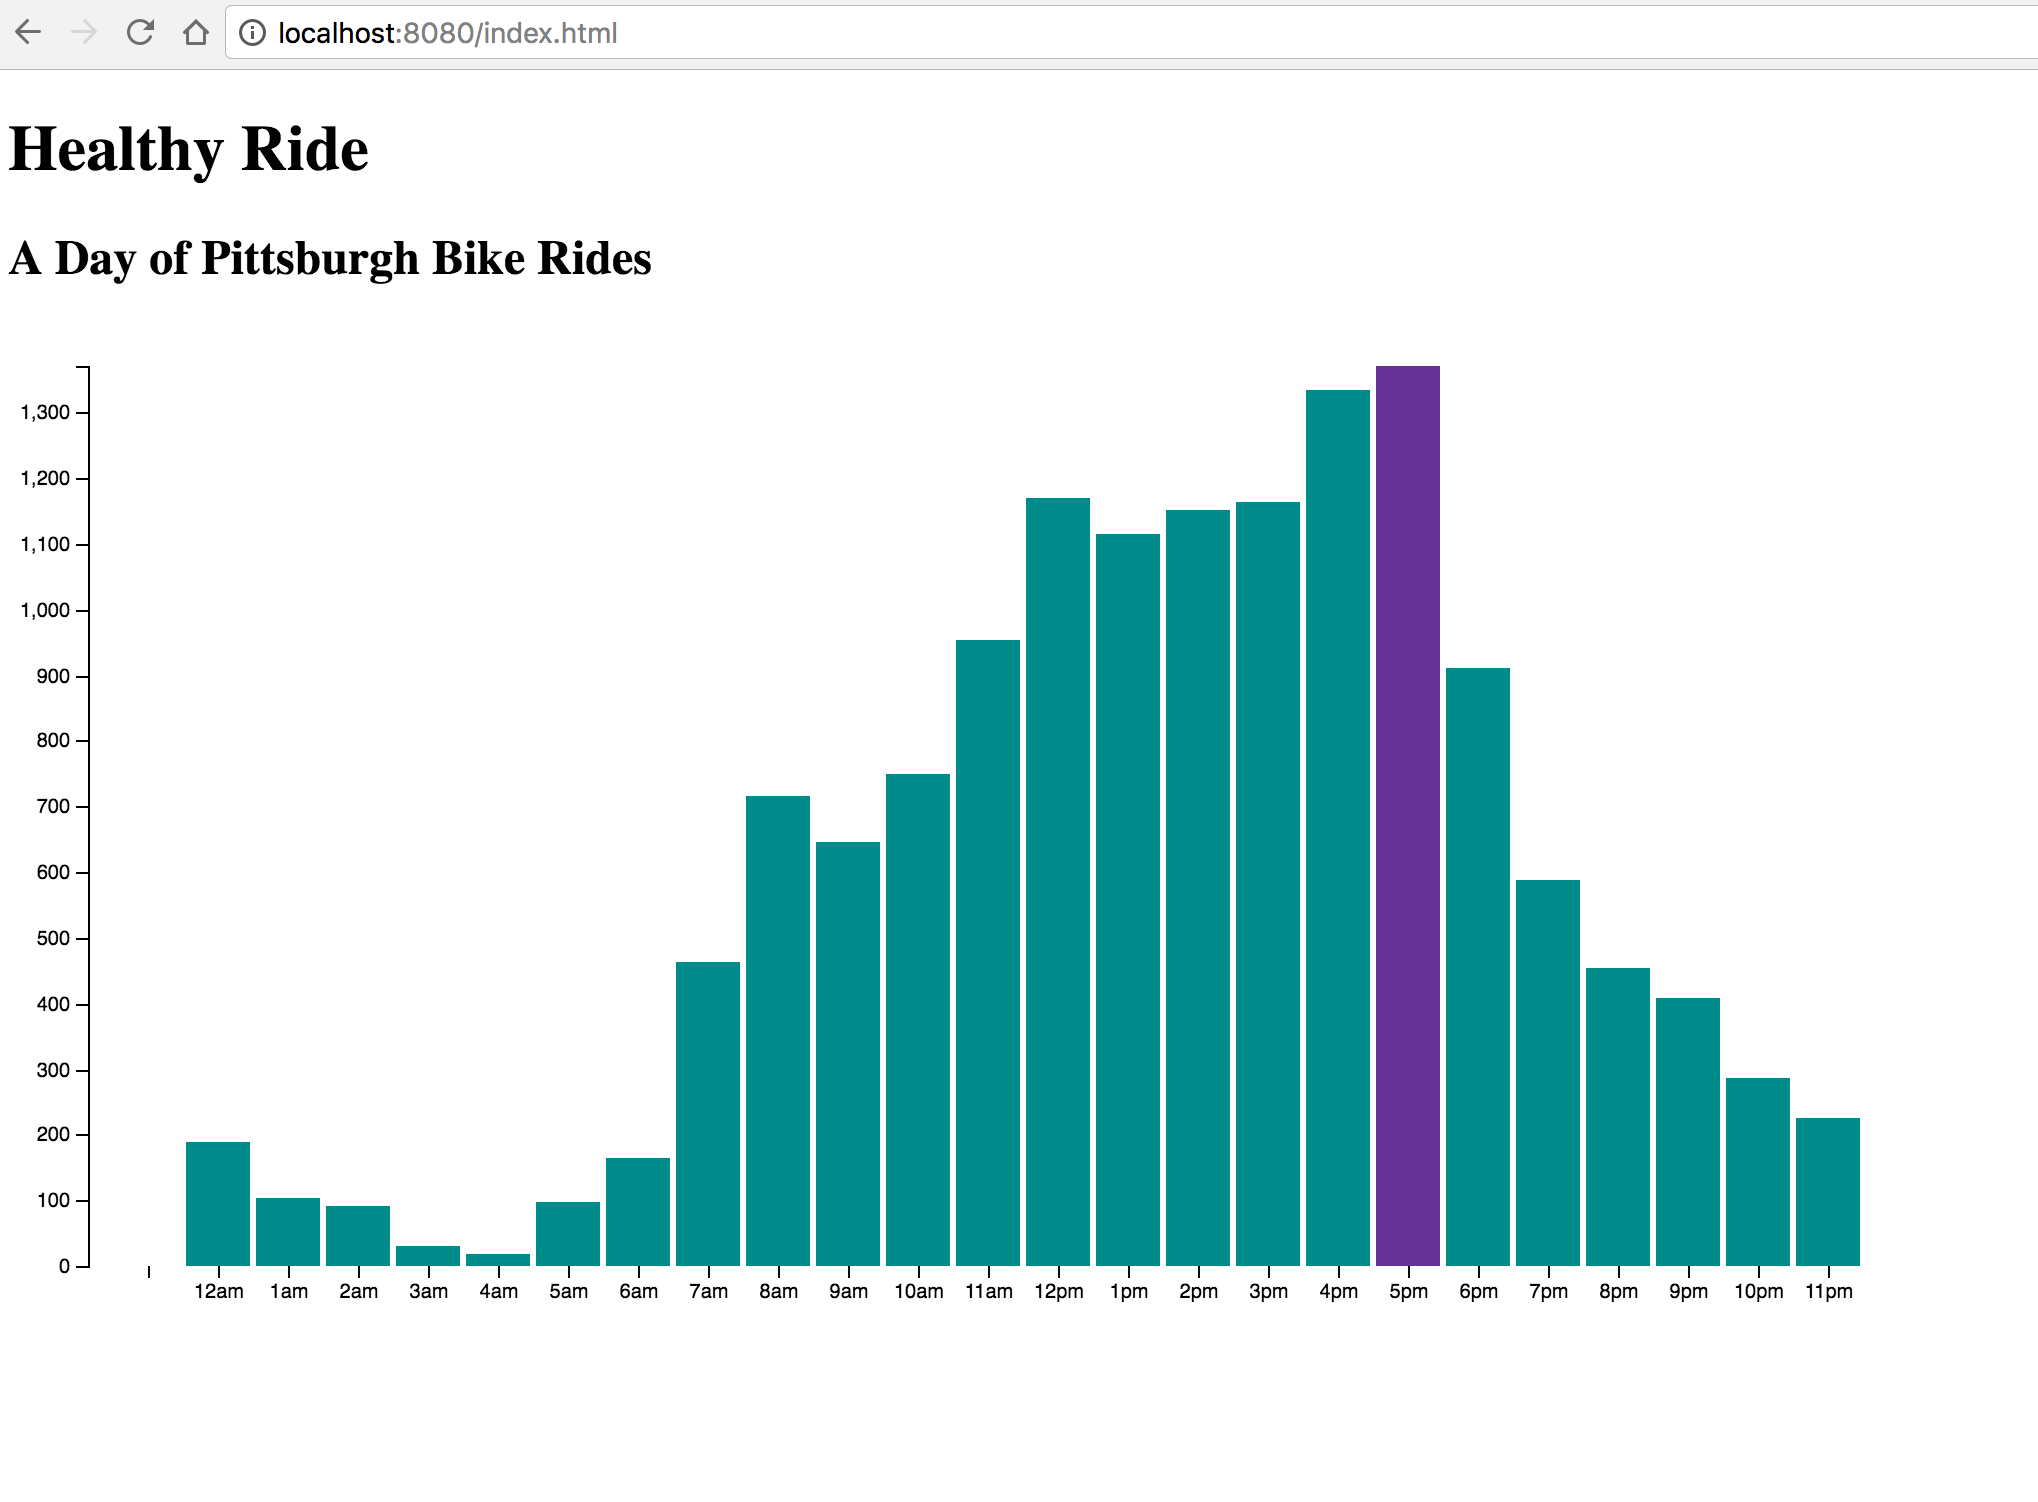
So, this was interesting, and an important lesson for me about parsing strings and creating tsv’s. I adapted (admittedly minimally) a Mike Bostock bar graph, and plotted the number of rides at each of the 24 hours in a day. I think with a lot more practice, I could come to like Javascript quite a lot. When you hover over the individual bars, the bar changes color – here shown in the web color “rebecca purple” which is a fun name for a color. I’d like to keep working with Javascript in future projects.
Table allRidesTable;
int ridesPerHour[];
void setup() {
ridesPerHour = new int[24];
for (int s=0; s<24; s++) {
ridesPerHour[s] = 0; // initialized to zero yo
}
allRidesTable = loadTable("HealthyRideRentals2015Q4.csv", "header");
// Trip id,Starttime,Stoptime,Bikeid,Tripduration,From station id,From station name,To station id,To station name,Usertype
int nRows = allRidesTable.getRowCount();
for (int i=0; i
Healthy Ride
A Day of Pittsburgh Bike Rides