HeatherKnight – LookingOutwards2
Below I present three gorgeous and structural explorations of data visualization spanning a traditional flat graphic, the surface of a building itself that brings its features into focus in a new way and an unusual setup for holstering a tree that brings into focus the drivers of its growth and its sugar maple strength.
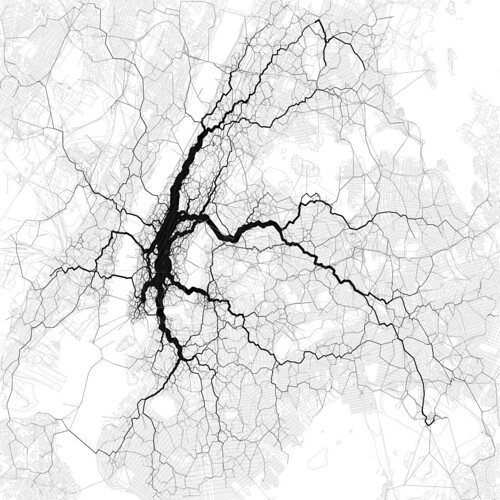
Visualizing 10,000 geotagged tweets in NYC for most popular travel corridors, by Eric Fischer, seeks to explore peoples working and commuting patterns.
via: http://mashable.com/2012/01/27/nyc-geotagged-tweets/
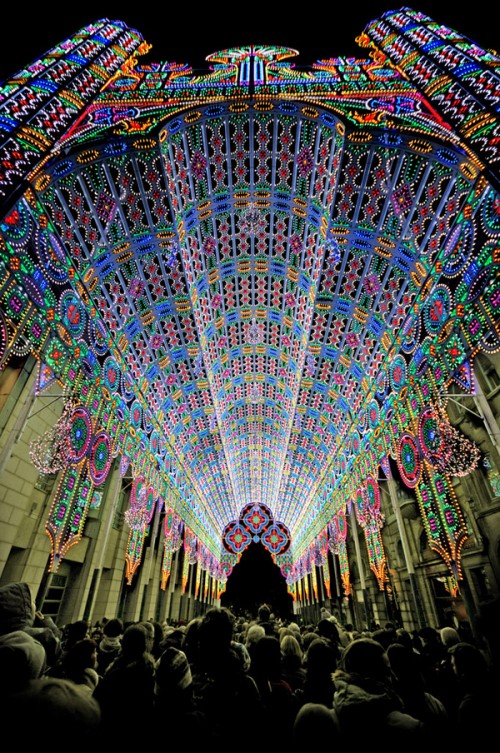
So this is how they get people to go to churches these days. Height visualization.
via: http://www.neatorama.com/2012/01/31/the-cathedral-of-light/
Natalie Jeremijenko’s Tree Logic at the Massachusetts MOMA
via: http://www.massmoca.org/event_details.php?id=29


