by madeline @ 10:21 pm 1 February 2012
Visualizing the Burst of the Housing Bubble
For my visualization project, I’ve been exploring data sets that have the potential directly inform the growth or decay of a digital object. I’m interested in creating a visualization that goes beyond re-presenting or re-associating quantitative data (despite it’s effectiveness at transforming data into information.) My goal is to have a visualization that translates cold, hard quantitative data into some sort of qualitative/emotive response from a viewer. I believe this can be done by crafting a collection of tangible objects that exhibit aggregated change over time.
Visualizing
I’ve been looking more and more into the statistical trends leading up to the 2006 housing bubble as a viable data set to visualize aggregated decay. The bubble-burst is of particular interest for me, as my part of the US (S. Florida) was hit very hard, with my hometown leading the nation in mortgage defaults. This fiscal disaster has been more damaging than most of the natural disasters that have hit this region in my lifetime.
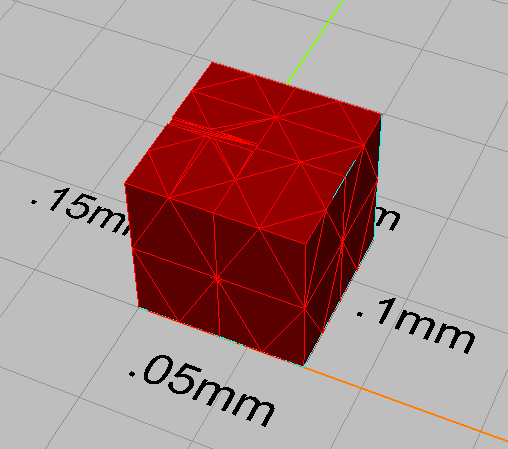
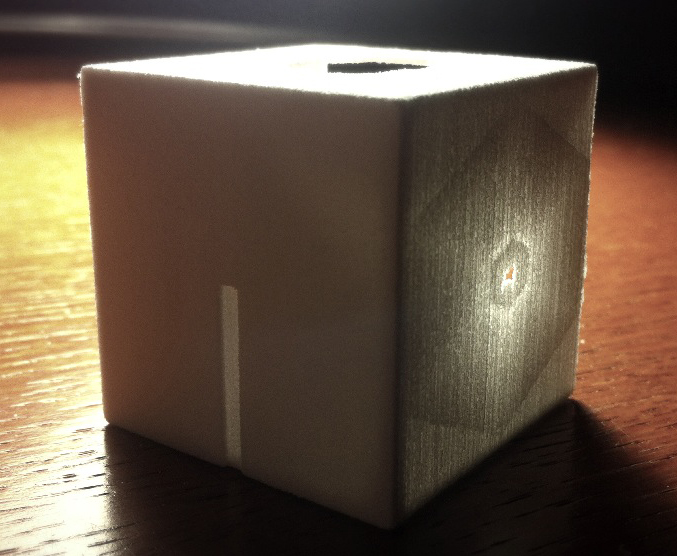
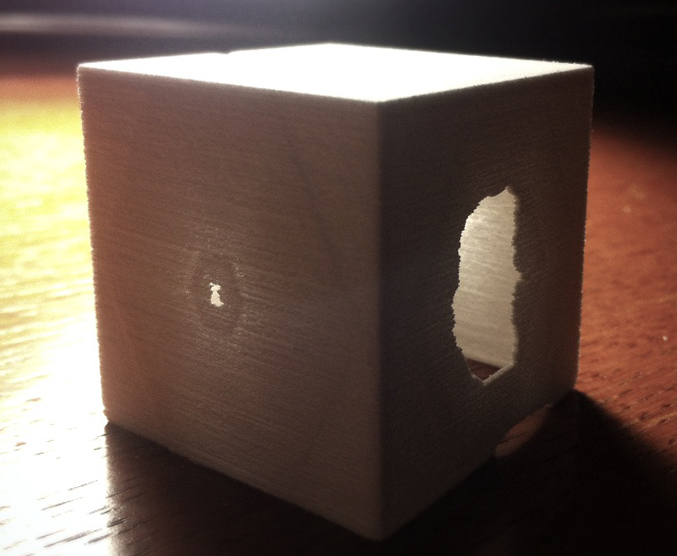
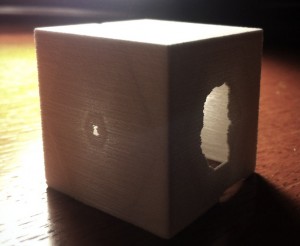
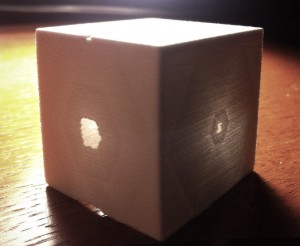
I began experimenting by misusing a plaster 3D printer to convey the sense of neglect / collapse / erosion / detritus that this data set quantifies. The images below show a series of tests that thinned areas of a printed wall beyond the material tolerances of the fabrication machine. I was surprised that the hexagonal mesh structure was expressed through the printing process, however I found that I can have systematic control over how and where the material fails, as well as the levels of opacity/translucency/transparency emitted:


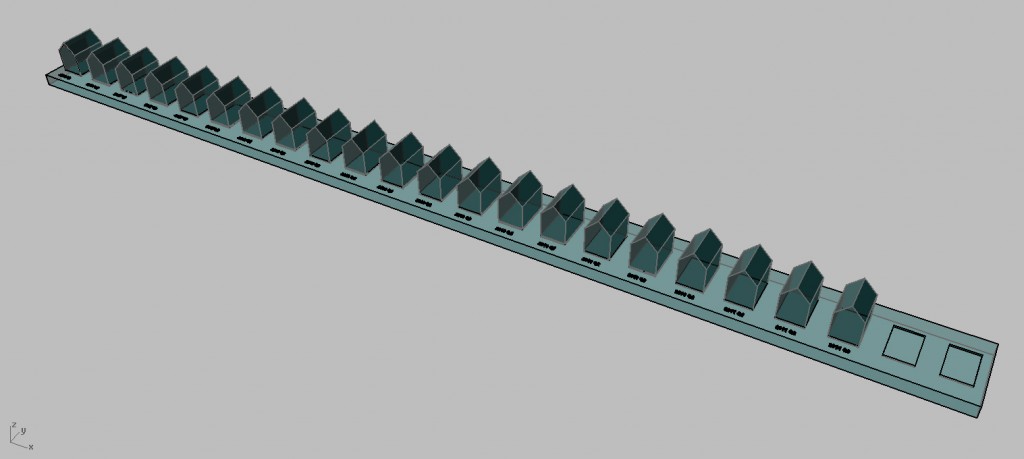
I’m thinking of printing a series of objects, one for each quarter since the bubble-burst, that are deformed based on the corresponding S&P/Case-Schiller index value (with places for future indices as the market continues to find an equilibrium):
Data Set
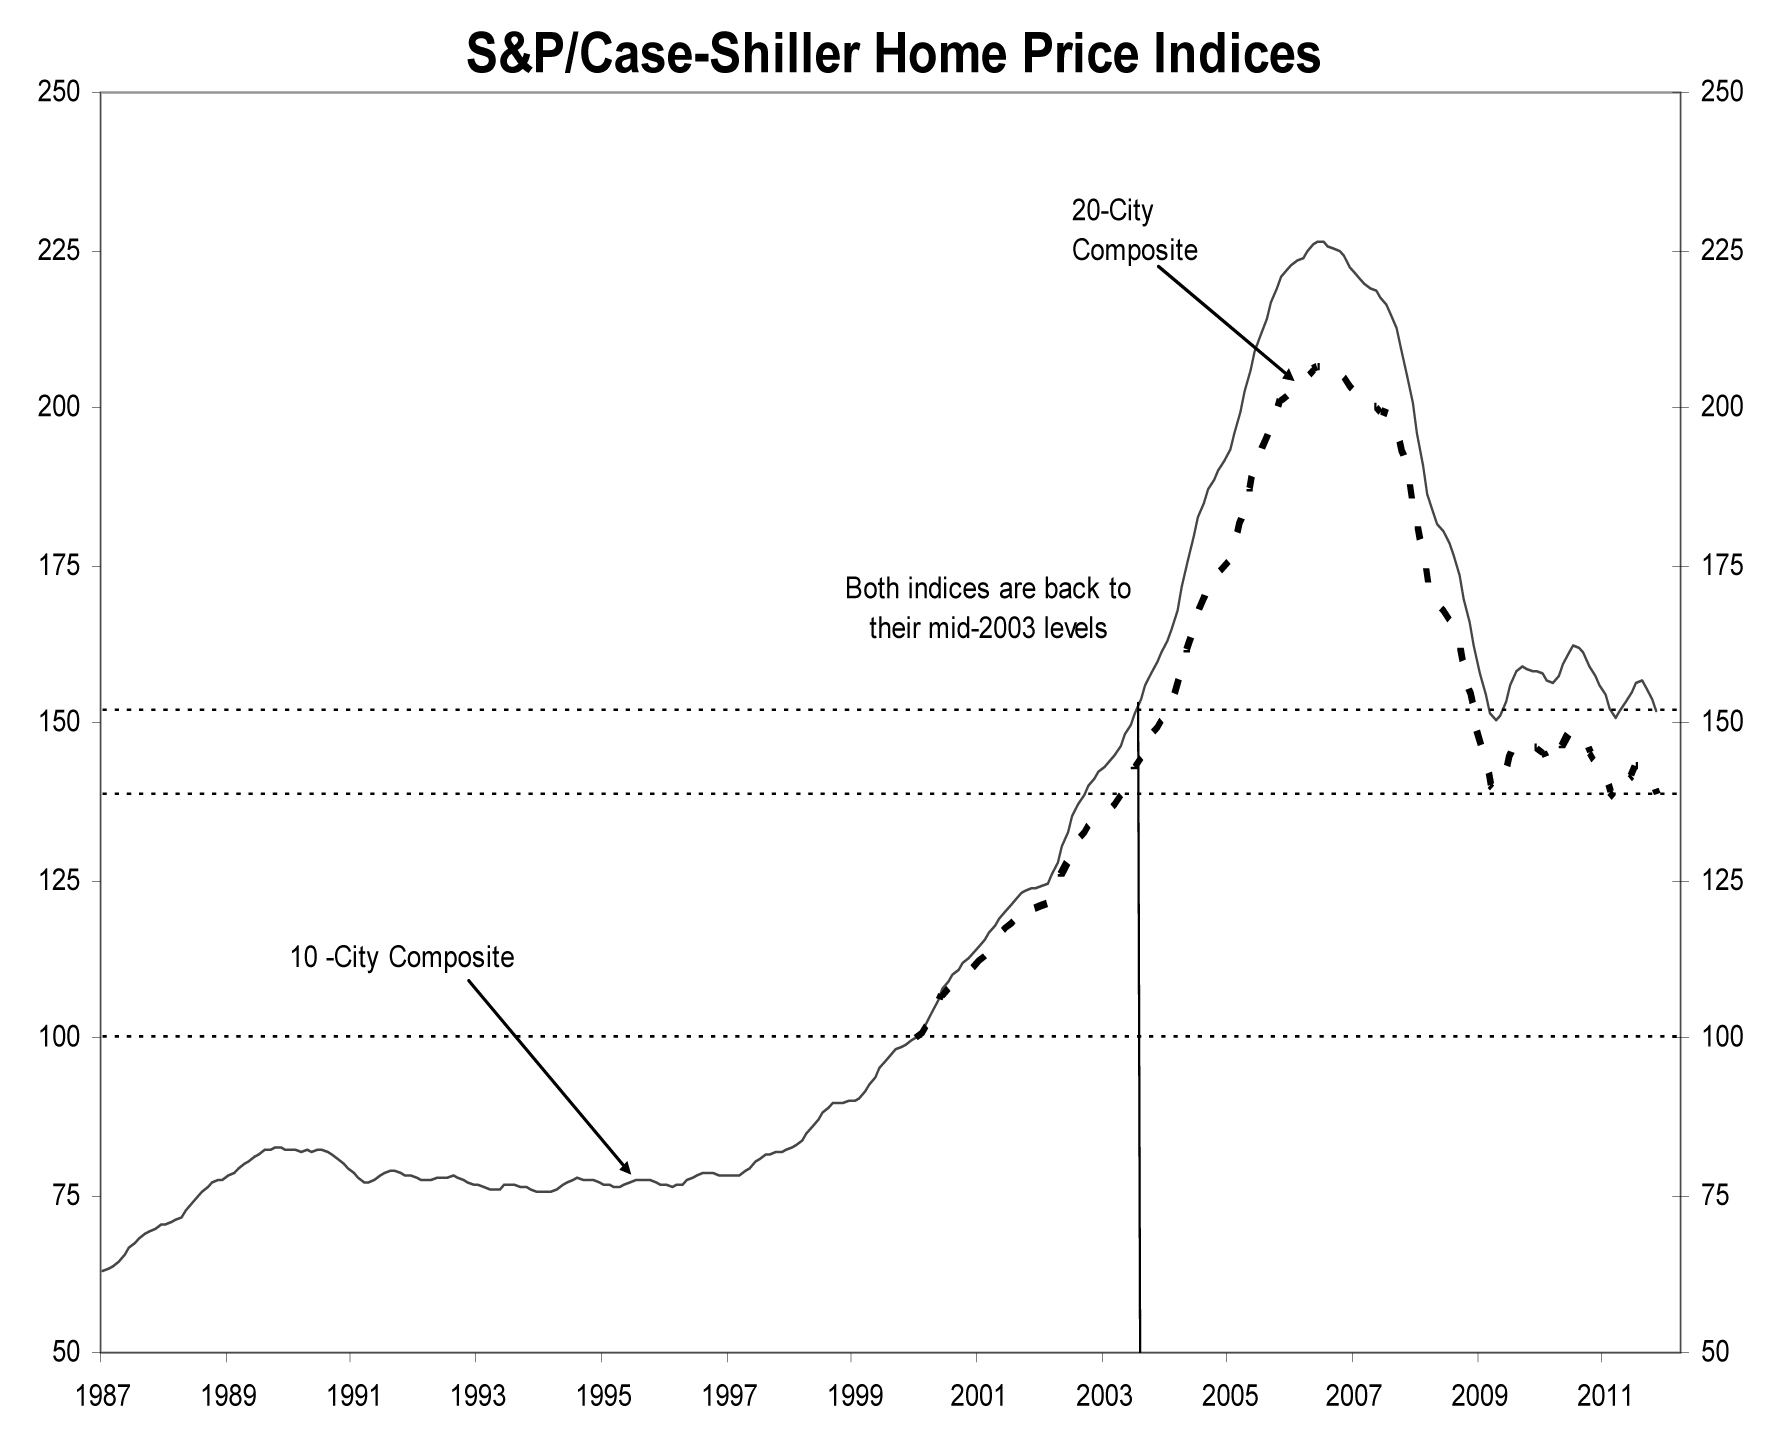
The S&P/Case-Schiller House Price Index is a national standard for gauging the state of the residential real-estate market. The index here shows the 10 and 20-City composite indices, and are quarterly values calculated through the volume of repeat sales of single family homes. The second quarter of 2006 held the all-time historic high for the market, the apex of the housing boom, and was followed by 12 straight quarters of collapse. The past 8 quarters have begun to stabilize, and are currently trending around the 2003 index rates.

Case-Schiller Home Price Index History_013118
Comments Off on MadelineGannon-Project2-sketch
by duncan @ 8:47 am 31 January 2012
The Virtual Choir
The Virtual Choir isn’t a traditional data visualization project – the project was created by conductor/composer Eric Whitacre in order to show hundreds of simultaneous singers performing his work, even though each track was recorded asynchronously. Although it could be considered a music video, seeing so many singers performing together, yet on their own, with the beautiful visualization is very awe-inspiring.
The project is rich in data, and I can imagine that the process of editing, synchronizing, and compositing all of the videos with all of the effects was an immense undertaking. But the project also has a lot of personal meaning for the singers involved, and there’s even a global visualization for where the singers came from. I’m sure there are plenty of other interesting ways to visualize and experience all of the singers’ videos other than for the sake of a balanced performance – the first thing that comes to mind would be blending/morphing the faces and voices of similar voice parts, to create an “average” voice part. It’d be very interesting to try to search for all of the original YouTube video auditions and recombine them in such a manner.
You can watch the video of the second Virtual Choir here:
[vimeo=22960177 width=550px]
Planetary
Planetary is an iOS app that visualizes a user’s music library as a planetarium of sorts, where each artist is represented as a star, albums are planets, and tracks are moons.
It didn’t take long for the bloom.io team to translate the relationships within a music library to the concept of celestial bodies, but the most interesting part of their work is the effort that went into optimizing and beautifying their display. I can completely see how they started off completely in 2D with only primitive graphics, but reading about the progression from 2D to 3D, stars to planets, and seeing the final visualizations of planets was very inspiring.
After only seeing their progression, however, it’s hard to get a sense of how well the planetary analogy works for browsing a music collection. Throughout my years of seeing documentaries and educational videos of planets and galaxies, seeing stars rush past and orbiting bodies inspires an immediate sense of scale and exciting exploration. Being able to look at music in a more emotional way seems like a great way to explore music just for the fun of it.
You can check out a video demo here:
[vimeo=23168163 width=550px]
Comments Off on Duncan Boehle – Looking Outwards 2